
Concept explainers
Videos
(a)
To construct: the Venn diagram to represent this setting.
(a)
Answer to Problem 7.43E
42%
Explanation of Solution
Given:
College students have posted a profile on Facebook =85%
Using MySpace regularly = 54%
Using both = 42%
Graph:
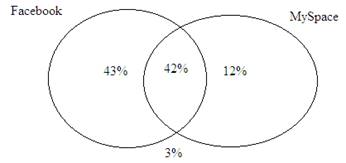
Drawing the two overlapping ellipses which name one is Facebook and another is MySpace. In the intersection area write the percent that use both. In the left side write the percent that use only Facebook and in the right side writes the percent that use only MySpace. Outside the ellipses write the percent that use neither.
(b)
To Explain: the
(b)
Answer to Problem 7.43E
Explanation of Solution
Suppose that F represent the Facebook user and
(c)
To Calculate: the probability of the event described in (b).
(c)
Answer to Problem 7.43E
Explanation of Solution
Given:

The probability is given in the right half of the Venn diagram
(d)
To construct: the two-way table for this setting if it possible and explain if not possible.
(d)
Answer to Problem 7.43E
Yes, Possible
Explanation of Solution
| F | Not F | Total | |
| M | 0.42 | 0.12 | 0.54 |
| Not M | 0.43 | 0.03 | 0.46 |
| Total | 0.85 | 0.15 | 1 |
Chapter 7 Solutions
Statistics Through Applications
Additional Math Textbook Solutions
Elementary Statistics (13th Edition)
Introductory Statistics
Intro Stats
Fundamentals of Statistics (5th Edition)
Essentials of Statistics, Books a la Carte Edition (5th Edition)
Introductory Statistics (2nd Edition)


 MATLAB: An Introduction with ApplicationsStatisticsISBN:9781119256830Author:Amos GilatPublisher:John Wiley & Sons Inc
 Probability and Statistics for Engineering and th...StatisticsISBN:9781305251809Author:Jay L. DevorePublisher:Cengage Learning
 Statistics for The Behavioral Sciences (MindTap C...StatisticsISBN:9781305504912Author:Frederick J Gravetter, Larry B. WallnauPublisher:Cengage Learning
 Elementary Statistics: Picturing the World (7th E...StatisticsISBN:9780134683416Author:Ron Larson, Betsy FarberPublisher:PEARSON
 The Basic Practice of StatisticsStatisticsISBN:9781319042578Author:David S. Moore, William I. Notz, Michael A. FlignerPublisher:W. H. Freeman
 Introduction to the Practice of StatisticsStatisticsISBN:9781319013387Author:David S. Moore, George P. McCabe, Bruce A. CraigPublisher:W. H. Freeman