
Managerial Accounting
15th Edition
ISBN: 9781337912020
Author: Carl Warren, Ph.d. Cma William B. Tayler
Publisher: South-Western College Pub
expand_more
expand_more
format_list_bulleted
Videos
Textbook Question
Chapter 7, Problem 4MAD
Segment disclosure by Apple Inc. (AAPL) provides sales information for its major product lines for three recent years as follows (in millions):
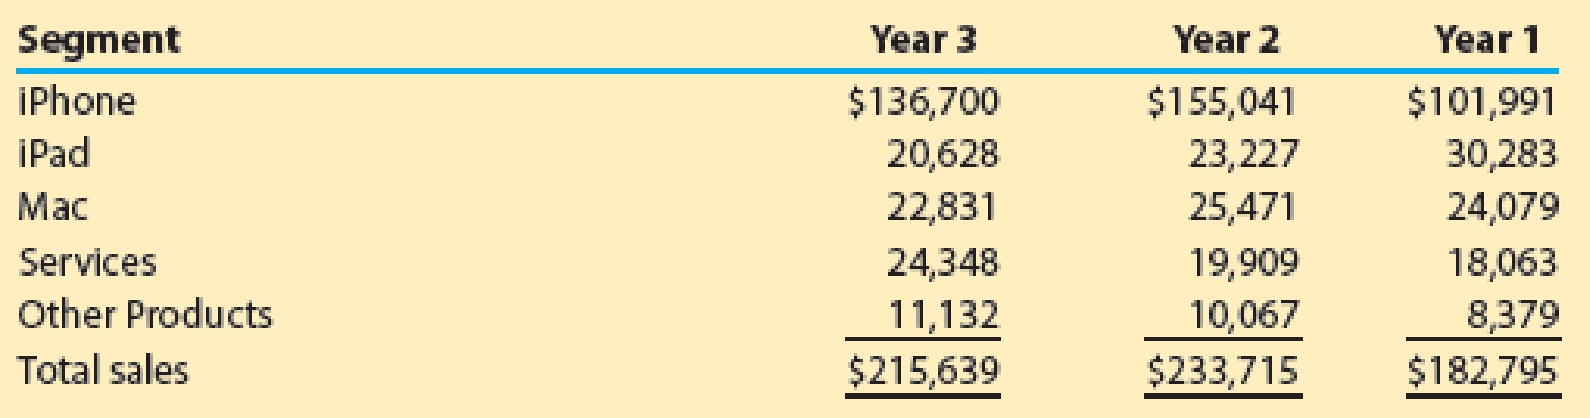
The Services segment includes sales from iTunes Store, App Store, Mac App Store, TV App Store, iBooks Store, Apple Music, AppleCare, and Apple Pay. The Other Products segment includes sales from Apple TV, Apple Watch, Beats products, iPod, and Apple-branded accessories.
- a. Which product had the greatest percentage of Year 3 sales? Which product had the least percentage of Year 3 sales? Round to nearest whole percent.
- b. Which product grew the most in sales, in percentage terms, using Year 1 as the base year? Round to nearest whole percent.
Expert Solution & Answer
Want to see the full answer?
Check out a sample textbook solution
Students have asked these similar questions
Analyze Apple Inc. by segment
Segment disclosure by Apple Inc. (AAPL) provides sales information for its major product lines for three recent years as follows (in millions):
Segment
Year 3
Year 2
Year 1
iPhone
$137,781
$142,381
$164,888
Mac
28,622
25,740
25,198
iPad
23,724
21,280
18,380
Wearables, Home Accessories
30,620
24,482
17,381
Services
53,768
46,291
39,748
Total
$274,515
$260,174
$265,595
The Wearables, Home Accessories segment includes Airpods, Apple Watch, and Apple TV. The Services segment includes sales from iTunes Store, App Store, Mac App Store, TV App Store, iBooks Store, Apple Music, AppleCare, and Apple Pay.
Question Content Area
a. Prepare a vertical analysis of Year 3 sales. (Round percentages to nearest whole percent.)
Segment
Year 3Sales
Percent ofTotal Sales
iPhone
$137,781
fill in the blank
Mac
28,622
fill in the blank
iPad
23,724
fill in the blank
Wearables, Home Accessories
30,620
fill in the blank
Services
53,768
fill…
Analyze Apple Inc. by segment
Segment disclosure by Apple Inc. (AAPL) provides sales information for its major product lines for three recent years as follows (in millions):
Segment
Year 3
Year 2
Year 1
iPhone
$136,700
$155,041
$101,991
iPad
20,628
23,227
30,283
Mac
22,831
25,471
24,079
Services
24,348
19,909
18,063
Other Products
11,132
10,067
8,379
Total sales
$215,639
$233,715
$182,795
The Services segment includes sales from iTunes Store, App Store, Mac App Store, TV App Store, iBooks Store, Apple Music, AppleCare, and Apple Pay. The Other Products segment includes sales from Apple TV, Apple Watch, Beats products, iPod, and Apple-branded accessories.
a. Prepare a vertical analysis of Year 3 sales. (Round percentages to nearest whole percent.)
GameWorld Corp. is the world's largest multichannel video game retailer. The company reported the following amounts (in millions) in
its annual financial statements at the end of January.
Net Sales Revenue
Cost of Goods Sold
Beginning Inventory
Ending Inventory
2016
$16,400
9,240
2,550
2,950
Inventory Turnover Ratio
Days to Sell
2015
$15,900
8,840
1,850
2,550
Required:
1. Determine the inventory turnover ratio and average days to sell inventory for 2016 and 2015. TIP: Remember to use costs in both
the numerator (CGS) and denominator (average inventory). (Use 365 days in a year. Round your intermediate and final answers to
1 decimal place.)
2016
times per year
days
2015
times per year
days
Chapter 7 Solutions
Managerial Accounting
Ch. 7 - What types of costs are customarily included in...Ch. 7 - Which type of manufacturing cost (direct...Ch. 7 - Which of the following costs would be included in...Ch. 7 - In the variable costing income statement, how are...Ch. 7 - Prob. 5DQCh. 7 - Prob. 6DQCh. 7 - Discuss how financial data prepared on the basis...Ch. 7 - Prob. 8DQCh. 7 - Explain why rewarding sales personnel on the basis...Ch. 7 - Explain why service companies use different...
Ch. 7 - Variable costing Marley Company has the following...Ch. 7 - Prob. 2BECh. 7 - Variable costingsales exceed production The...Ch. 7 - Prob. 4BECh. 7 - Contribution margin by segment The following...Ch. 7 - At the end of the first year of operations, 21,500...Ch. 7 - Gallatin County Motors Inc. assembles and sells...Ch. 7 - Fresno Industries Inc. manufactures and sells...Ch. 7 - On March 31, the end of the first month of...Ch. 7 - On April 30, the end of the first month of...Ch. 7 - On October 31, the end of the first month of...Ch. 7 - The following data were adapted from a recent...Ch. 7 - Estimated income statements, using absorption and...Ch. 7 - The following data were adapted from a recent...Ch. 7 - Prob. 10ECh. 7 - Explain why service companies use different...Ch. 7 - Galaxy Sports Inc. manufactures and sells two...Ch. 7 - Prob. 13ECh. 7 - Sales territory and salesperson profitability...Ch. 7 - Prob. 15ECh. 7 - Prob. 16ECh. 7 - Variable costing income statement for a service...Ch. 7 - Variable costing income statement for a service...Ch. 7 - Prob. 1PACh. 7 - The demand for solvent, one of numerous products...Ch. 7 - During the first month of operations ended May 31,...Ch. 7 - Salespersons report and analysis Walthman...Ch. 7 - Segment variable costing income statement and...Ch. 7 - Absorption and variable costing income statements...Ch. 7 - Income statements under absorption costing and...Ch. 7 - Absorption and variable costing income statements...Ch. 7 - Prob. 4PBCh. 7 - Variable costing income statement and effect on...Ch. 7 - Prob. 1MADCh. 7 - Prob. 2MADCh. 7 - Prob. 3MADCh. 7 - Segment disclosure by Apple Inc. (AAPL) provides...Ch. 7 - Prob. 1TIFCh. 7 - Inventory effects under absorption costing BendOR,...Ch. 7 - Communication Bon Jager Inc. manufactures and...Ch. 7 - Prob. 1CMACh. 7 - Chassen Company, a cracker and cookie...Ch. 7 - Prob. 3CMACh. 7 - Bethany Company has just completed the first month...
Knowledge Booster


Learn more about
Need a deep-dive on the concept behind this application? Look no further. Learn more about this topic, accounting and related others by exploring similar questions and additional content below.Similar questions
- Apple Inc. designs, manufactures, and markets personal computers and related personal computing and communicating solutions for sale primarily to education, creative, consumer, and business customers. Substantially all of the companys sales over the last five years are from sales of its Macs, iPods, iPads, and related software and peripherals. For two recent fiscal years, Apple reported the following (in millions): Assume that the accounts receivable (in millions) were 24,094 at the beginning of fiscal Year 1. 1. Compute the accounts receivable turnover for Year 2 and Year 1. Round to two decimal places. 2. Compute the days sales in receivables at the end of Year 2 and Year 1. Use 365 days and round to one decimal place. 3. What conclusions can be drawn from (1) and (2) regarding Apples efficiency in collecting receivables?arrow_forwardThe following revenue data were taken from the December 31, 2017, General Electric annual report (10-K): For each segment and each year, calculate intersegment sales (another name for transfer sales) as a percentage of total sales. Using Microsoft Excel or another spreadsheet application, create a clustered column graph to show the 2016 and 2017 percentages for each division. Comment on your observations of this data. How might a division sales manager use this data?arrow_forwardThe following revenue data were taken from the December 31, 2017, Coca-Cola annual report (10-K): For each segment and each year, calculate intersegment sales (another name for transfer sales) as a percentage of total sales, Using Microsoft Excel or another spreadsheet application, create a clustered column graph to show the 2016 and 2017 percentages for each division. Comment on your observations of this data. How might a division sales manager use this data?arrow_forward
- Apple Inc.: Segment revenue analysis Segment disclosure by Apple Inc. provides sales information for its major product lines for three recent years as follows (in millions): A. Which product had the greatest percentage of Year 3 sales? Which product had the least percentage of Year 3 sales? (Round to nearest whole percent.) B. Which product grew the most in sales, in percentage terms, using Year 1 as the base year? (Round to nearest whole percent.)arrow_forwardApple Inc. designs, manufactures, and markets personal computers and related personal computing and communicating solutions for sale primarily to education, creative, consumer, and business customers. Substantially all of the company's sales over the last five years are from sales of its Macs, iPods, iPads, and related software and peripherals. For two recent fiscal years, Apple reported the following (in millions): Year 2 Year 1 Sales $233,715 $182,795 Accounts receivable at end of year 35,889 31,537 Assume that the accounts receivable (in millions) were $24,094 at the beginning of fiscal Year 1. 1. Compute the accounts receivable turnover for Year 2 and Year 1. Round to two decimal places. 2. Compute the days' sales in receivables at the end of Year 2 and Year 1. Use 365 days and round to one decimal place. What conclusions can be drawn from (1) and (2) regarding Apple's efficiency 3. in collecting receivables?arrow_forwardThe following data (in millions) were taken from recent annual reports of Apple Inc., a manufacturer of personal computers and related products, and Mattel Inc., a manufacturer of toys, including Barbie®, Hot Wheels®, and Disney Classics: Apple Mattel Cost of merchandise sold $140,089 $2,896 Inventory, end of year 2,349 588 Inventory, beginning of the year 2,111 562 a. Determine the inventory turnover for Apple and Mattel. Round to one decimal place. b. Would you expect Mattel's inventory turnover to be higher or lower than Apple's? Why?arrow_forward
- The following data (in millions) were taken from recent annual reports of Apple Inc., a manufacturer of personal computers and related products, and Mattel Inc., a manufacturer of toys, including Barbie®, Hot Wheels®, and Disney Classics: Apple Mattel Cost of merchandise sold $140,089 $2,896 Inventory, end of year 2,349 588 Inventory, beginning of the year 2,111 562 a. Determine the inventory turnover for Apple and Mattel. Round to one decimal place. Apple Mattel b. Would you expect Mattel’s inventory turnover to be higher or lower than Apple’s?arrow_forwardThe general merchandise retail industry has a number of segments represented by the following companies: For a recent year, the following cost of goods sold and beginning and ending inventories are provided from corporate annual reports (in millions) for these three companies: a. Determine the inventory turnover ratio for all three companies. Round all calculations to one decimal place. b. Determine the number of days sales in inventory for all three companies. Use 365 days and round all calculations to one decimal place. c. Interpret these results based on each companys merchandising concept.arrow_forwardRevenue and expense data for the current calendar year for Tannenhill Company and for the electronics industry are as follows. Tannenhill’s data are expressed in dollars. The electronics industry averages are expressed in percentages. TannenhillCompany ElectronicsIndustryAverage Sales $2,540,000 100 % Cost of merchandise sold 1,473,200 63 Gross profit $1,066,800 37 % Selling expenses $660,400 22 % Administrative expenses 254,000 9 Total operating expenses $914,400 31 % Income from operations $152,400 6 % Other revenue and expense: Other revenue 50,800 2 Other expense (25,400) 1 Income before income tax expense $177,800 7 % Income tax expense 76,200 4 Net income $101,600 3 % Question Content Area a. Prepare a common-sized income statement comparing the results of operations for Tannenhill Company with the industry average. If required, round percentages to one decimal place. Enter…arrow_forward
- Access the February 21, 2017, filing of the December 31, 2016, 10-K report of The Hershey Company (ticker: HSY) at SEC.gov and complete the following requirements. Required Compute or identify the following profitability ratios of Hershey for its years ending December 31, 2016, and December 31, 2015. Interpret its profitability using the results obtained for these two years. 1. Profit margin ratio (round the percent to one decimal). 2. Gross profit ratio (round the percent to one decimal). 3. Return on total assets (round the percent to one decimal). (Total assets at year-end 2014 were $5,622,870 in thousands.) 4. Return on common stockholders’ equity (round the percent to one decimal). (Total shareholders’ equity at year-end 2014 was $1,519,530 in thousands.) 5. Basic net income per common share (round to the nearest cent).arrow_forwardThe general merchandise retail industry has a number of segments represented by the following companies: For a recent year, the following cost of goods sold and beginning and ending inventories arc provided from corporate annual reports (in millions) for these three companies: a. Determine the inventory turnover ratio for all three companies. Round all calculations to one decimal place.b. Determine the number of days' sales in inventory for all three companies. Use 365 days and round all calculations to one decimal place. c.Interpret these results based on each company's merchandising concept.arrow_forwardFollowing are 2017 and 2018 revenue data for Honeywell International's four segments. Use these data to forecast its 2019 revenue. Note: Complete the entire question using the following Excel template: Excel Template. Then enter the answers into the provided spaces below with two decimal places. Honeywell International Segment Sales and Business-Unit Sales by Segment $ millions 2018 2017 Aerospace sales Commercial aviation original equipment Commercial aviation aftermarket Defense and space Transportation systems Total aerospace sales Honeywell building technologies sales Homes Buildings Total Honeywell building technologies sales Performance materials and technologies sales UOP Russell LLP Process solutions Advanced materials Total performance materials and technologies sales $3,591 $2,475 5,373 5,861 5,423 4,053 2,622 3,906 $17,009 $16,295 $4,686 $4,482 5,370 6,053 $10,056 $10,535 $3,603 $2,753 4,981 5,553 3,606 2,791 $12,190 $11,097 Safety and productivity solutions sales Safety…arrow_forward
arrow_back_ios
SEE MORE QUESTIONS
arrow_forward_ios
Recommended textbooks for you
 Managerial AccountingAccountingISBN:9781337912020Author:Carl Warren, Ph.d. Cma William B. TaylerPublisher:South-Western College Pub
 Financial And Managerial AccountingAccountingISBN:9781337902663Author:WARREN, Carl S.Publisher:Cengage Learning,
 Financial & Managerial AccountingAccountingISBN:9781337119207Author:Carl Warren, James M. Reeve, Jonathan DuchacPublisher:Cengage Learning
 Principles of Accounting Volume 2AccountingISBN:9781947172609Author:OpenStaxPublisher:OpenStax College
 Financial AccountingAccountingISBN:9781305088436Author:Carl Warren, Jim Reeve, Jonathan DuchacPublisher:Cengage Learning
Managerial Accounting
Accounting
ISBN:9781337912020
Author:Carl Warren, Ph.d. Cma William B. Tayler
Publisher:South-Western College Pub
Financial And Managerial Accounting
Accounting
ISBN:9781337902663
Author:WARREN, Carl S.
Publisher:Cengage Learning,
Financial & Managerial Accounting
Accounting
ISBN:9781337119207
Author:Carl Warren, James M. Reeve, Jonathan Duchac
Publisher:Cengage Learning
Principles of Accounting Volume 2
Accounting
ISBN:9781947172609
Author:OpenStax
Publisher:OpenStax College
Financial Accounting
Accounting
ISBN:9781305088436
Author:Carl Warren, Jim Reeve, Jonathan Duchac
Publisher:Cengage Learning
How To Analyze an Income Statement; Author: Daniel Pronk;https://www.youtube.com/watch?v=uVHGgSXtQmE;License: Standard Youtube License