
Concept explainers
Videos
Recently, you were assigned to manage a project to remodel the seminar room for your company. You have constructed a network diagram depicting the various activities in the project (Figure 7.13). In addition, you have asked your team to estimate the amount of time that they would expect each of the activities to take. Their responses are shown in the following table.
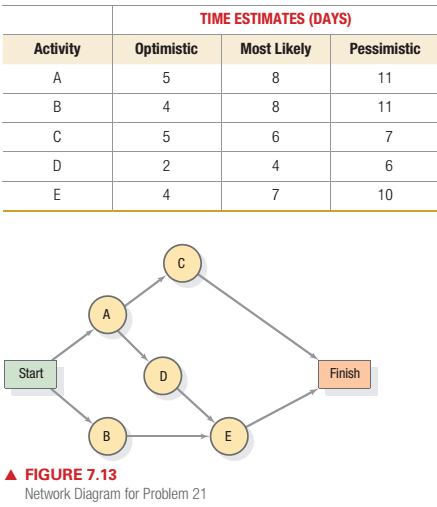
- What is the expected completion time of the project?
- What is the probability of completing the project in 21 days or less?
- What is the probability of completing the project in 17 days or less?

Trending nowThis is a popular solution!

Chapter 7 Solutions
Operations Management: Processes and Supply Chains (12th Edition) (What's New in Operations Management)
Additional Business Textbook Solutions
Principles of Operations Management: Sustainability and Supply Chain Management (10th Edition)
Business in Action (8th Edition)
OPERATIONS MANAGEMENT IN THE SUPPLY CHAIN: DECISIONS & CASES (Mcgraw-hill Series Operations and Decision Sciences)
Business in Action
Operations Management
Operations Management, Binder Ready Version: An Integrated Approach


- Three activities are candidates for crashing on a project network for a large computer installation (all are, of course, critical) Activity details are in the following table: a) Activity that should be orashed first to reduce the project duration by 1 day is b) Activity that should be crashed next to reduce the project duration by one additional day is c) Total cost of crashing the project by 2 days = S (Enter your response as an integer) Normal Activity Time (days) A B C 7 4 11 Crash Normal Time (days) Cost $8,000 $1,200 $4,200 6 2 9 Total Cost with Crashing Immediate Predecessor(s) $6,500 $3,000 $6.200 A Barrow_forwardYou are in charge of a project. Your team has determined that there are 7 activities to be completed. Here are the activities, the time to complete the activity and the immediate predecessor of the activity. Using this data 1) construct a Gantt Chart, 2) determine the time it will take to complete the project, 3) You are monitoring the progress of this project and discover that activity C is in danger of taking longer than planned due to funding issues. What options do you have to get the project back on track? Activity Time Immediate Predecessor A 10 Weeks None B 6 Weeks A C 7 Weeks A D 6 Weeks B E 8 Weeks C F 3 Weeks D G 4 Weeks Farrow_forwardFor this assignment, you will design a risk management plan for a project titled “prolonged waiting times for patients in a large outpatient hospital” that will include the following elements: Risk Register/Matrix (list of at least 5 (five) risks along with the associated impact and probability scores along with risk score) Contingency plan (list of any risks you will plan for in advance along with what triggers the contingency). Be sure to include any information useful to stakeholders on the rationale for the creation of these elements as well as any outside references supporting the risk management plan.arrow_forward
- Project Management involves the management of labour, material and plants, and equipment. Time management however demands the analysis of factors prevailing on the project.Discuss four (4) factors that affect the times it will take to complete the projectarrow_forwardUsing project management software to explore the effects of various scenarios on the project is called: projection sorting what-if analysis filteringarrow_forwardYou are in charge of a project at the local community center. The center needs to remodel one ofthe rooms in time for the start of a new program. Delays in the project mean that the center mustrent other space at a nearby church at additional cost. Time and cost data for your project arecontained in below table. Your interest is in minimizing the cost of the project to the communitycenter.Using the normal times for each activity, what is the earliest date you can complete the project?Suppose the variable overhead costs are $50 per day for your project. Also, suppose that thecenter must pay $40 per day for a temporary room on day 15 or beyond. Find the minimum-costproject schedule using below format.The AON diagram for the community center project is below. Crash 4 times and find total cost.arrow_forward
- You are in charge of a project at the local community center. The center needs to remodel one of the rooms in time for the start of a new program. Delays in the project mean that the center must rent other space at a nearby church at additional cost. Time and cost data for your project are contained in the table. Your interest is in minimizing the cost of the project to the community center. a. Using the normal times for each activity, what is the earliest date you can complete the project? b. Suppose the variable overhead costs are $50 per day for your project. Also, suppose that the center must pay$40 per day for a temporary room on day 15 or beyond. Find the minimum-cost project schedule.arrow_forwardManagement & Science University (MSU) have appointed you as a project manager to conduct a Joint Application Design (JAD) session with members from various departments. As a project manager, you are required to develop a specific schedule for the tasks listed below. The estimated task duration for each shown in parentheses. First, you must contact and brief the participants and explain their responsibilities (1 day). Then you must obtain approval from their department managers (3 days). After you have obtained the approval, you can begin the two tasks where you can prepare the agenda for the JAD session (7 days) and arrange the meeting room (2 days) When the agenda is ready, you can start two more concurrent tasks which are preparing the information packets (4 days) and to create visual aids (8 days). When the meeting room is arranged and information packets are ready, you can send out an email to all participants (1 day). Finally, after the e-mail is sent to participants and the…arrow_forwardBelow is a project listed in a table with: activity, predecessor, and duration. Activity A B с D E F G H Predecessor none A A с B B D, E, F G Fill in the chart below by filling in: early start (ES), early finish (EF), ☐late start (LS), A late finish (LF), duration (D), and float (F). Then, answer the questions based on the chart. Hint: You can use the Word tools to fill in the chart, or you can draw the chart by hand, then photograph or scan your graph to submit it. 1. Fill in the chart below. B Duration (weeks) C 5 3 8 13 7 9 10 7 - D E F G Harrow_forward
- We are the project manager for an IT project in our company. We identified the following top-level project tasks and estimated durations to standup a small test lab for the project: Identify test lab building/space requirements and possible locations(8days) Select best location for lab (1day) Once the best location is selected, immediately start the next two tasks: Prepare lab space with power and cabling (3days) Identify/procure required specialized test lab hardware/software(5) Once the lab space is prepared, install/check out available infrastructure hardware/software(1day). Once the specialized software/hardware is received and the infrastructure hardware/software is installed/checked out, install/checkout specialized software/hardware (2days) Once all tasks are completed, conduct the final inspection (1 day). Let's create a PERT/CPM chart for this project and identify the overall project duration and critical path.arrow_forwardThe managers at AllBirds have operations in multiple countries, which operate on different financial management systems. This has been increasingly challenging for the company, so the Justin is looking to consolidate and integrate the financial management across all locations into a single software system that can operate across the national boundaries. This is a new, complicated and lengthy project, so Justin has identified a set of activity categories that will need to be carefully managed, as noted in the table. What is the probability that project can be completed two months early?arrow_forwardWith the use of a diagram, show (illustrate) the typical levels of project staffing related to each phase and throughout a project With the use of a diagram, show (illustrate) the typical levels of uncertainty or project risks associated with each phase and throughout a project.arrow_forward
 Practical Management ScienceOperations ManagementISBN:9781337406659Author:WINSTON, Wayne L.Publisher:Cengage,
 Operations ManagementOperations ManagementISBN:9781259667473Author:William J StevensonPublisher:McGraw-Hill Education
 Operations and Supply Chain Management (Mcgraw-hi...Operations ManagementISBN:9781259666100Author:F. Robert Jacobs, Richard B ChasePublisher:McGraw-Hill Education
 Purchasing and Supply Chain ManagementOperations ManagementISBN:9781285869681Author:Robert M. Monczka, Robert B. Handfield, Larry C. Giunipero, James L. PattersonPublisher:Cengage Learning
 Production and Operations Analysis, Seventh Editi...Operations ManagementISBN:9781478623069Author:Steven Nahmias, Tava Lennon OlsenPublisher:Waveland Press, Inc.