
Concept explainers
Videos
Archer Company is a wholesaler of custom-built air-conditioning units for commercial buildings. It gathered the following monthly data relating to units shipped and total shipping expense: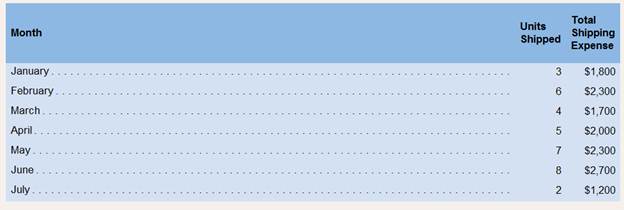
Required
1. Prepare a scattergraph using the data given above. Plot cost on the vertical axis and activity on the horizontal axis. Is there an approximately linear relationship between shipping expense and the number of units shipped?
2. Using the high-low method, estimate the cost formula for shipping expense. Draw a straight line through the high and low data points shown in the scattergraph that von prepared in requirement (1). Make sure vow line intersects the Y-axis.
3. Comment on the accuracy of vow high-low estimates assuming a least-squares regression analysis estimated the total fixed costs to be $91071 per month and the variable cost to be $217.86 per unit. How would the straight line that yon drew in requirement 2 differ from a straight line that minimizes the sum of the squared errors?
4. What factors, other than the number of units shipped, are likely to affect the company's shipping expense? Explain.
Want to see the full answer?
Check out a sample textbook solution
Chapter 6 Solutions
Introduction To Managerial Accounting


- Method of Least Squares, Predicting Cost for Different Time Periods from the One Used to Develop a Cost Formula Refer to the information for Farnsworth Company on the previous page. However, assume that Tracy has used the method of least squares on the receiving data and has gotten the following results: Required: 1. Using the results from the method of least squares, prepare a cost formula for the receiving activity. 2. Using the formula from Requirement 1, what is the predicted cost of receiving for a month in which 1,450 receiving orders are processed? (Note: Round your answer to the nearest dollar.) 3. Prepare a cost formula for the receiving activity for a quarter. Based on this formula, what is the predicted cost of receiving for a quarter in which 4,650 receiving orders are anticipated? Prepare a cost formula for the receiving activity for a year. Based on this formula, what is the predicted cost of receiving for a year in which 18,000 receiving orders are anticipated?arrow_forwardLarsen, Inc., produces two types of electronic parts and has provided the following data: There are four activities: machining, setting up, testing, and purchasing. Required: 1. Calculate the activity consumption ratios for each product. 2. Calculate the consumption ratios for the plantwide rate (direct labor hours). When compared with the activity ratios, what can you say about the relative accuracy of a plantwide rate? Which product is undercosted? 3. What if the machine hours were used for the plantwide rate? Would this remove the cost distortion of a plantwide rate?arrow_forwardPatterson Company produces wafers for integrated circuits. Data for the most recent year are provided: aCalculated using number of dies as the single unit-level driver. bCalculated by multiplying the consumption ratio of each product by the cost of each activity. Required: 1. Using the five most expensive activities, calculate the overhead cost assigned to each product. Assume that the costs of the other activities are assigned in proportion to the cost of the five activities. 2. Calculate the error relative to the fully specified ABC product cost and comment on the outcome. 3. What if activities 1, 2, 5, and 8 each had a cost of 650,000 and the remaining activities had a cost of 50,000? Calculate the cost assigned to Wafer A by a fully specified ABC system and then by an approximately relevant ABC approach. Comment on the implications for the approximately relevant approach.arrow_forward
- Company, which uses the high-low method to analyze cost behavior, has determined that machine hours best predict the company's total utilities cost. The company's cost and machine hour usage data for the first six months of the year follow:arrow_forwardConvert the accompanying database to an excel table to find: a. The total cost of all orders b. The total quantity of airframe fasteners purchased. c. The total cost of all orders placed with Manley Valve.arrow_forwardquestion is in image. Required: Prepare a schedule of cost of goods manufactured. Prepare a schedule of cost of goods sold. Prepare an income statement. Build a spreadsheet: Construct an Excel spreadsheet to solve all of the preceding requirements. Show how both cost schedules and the income statement will change if the following data change: direct labor is $390,000 and utilities cost $35,000.arrow_forward
- Write a linear cost function equation for each of the following conditions. Use y for estimated costsand X for activity of the cost driver. Machine operating costs include $1,000 of maintenance per month, and $15.00 of coolant usagecosts for each day the machinery is in operation.arrow_forwardThe managing director of a consulting group has the accompanying monthly data on total overhead costs and professional labor hours to bill to clients. Complete parts a through c. Click the icon to view the monthly data. a. Develop a simple linear regression model between billable hours and overhead costs. Overhead Costs = +xBillable Hours X Monthly Overhead Costs and Billable Hours Data (Round the constant to one decimal place as needed. Round the coefficient to four decimal places as needed. Do not include the $ symbol in your answers.) Overhead Costs Billable Hours 0 $315,000 3,000 $365,000 4,000 $395,000 5,000 $447,000 6,000 $530,000 7,000 $550,000 8,000arrow_forwardGreen Shade manufactures insulated windows. The firm’s repair and maintenance (R&M) cost is mixed and varies most directly with machine hours worked. The following data (on the attached picture) have been gathered from recent operations: a. Use the high–low method to estimate a cost formula for repairs and maintenance. b. Use least squares regression to estimate a cost formula for repairs and maintenance. c. Does the answer to part (a) or to part (b) provide the better estimate of the relation ship between repairs and maintenance costs and machine hours? Why?arrow_forward
- Matching graphs with descriptions of cost and revenue behavior. (D. Green, adapted) Given here are a number of graphs. The horizontal axis of each graph represents the units produced over the year, and the vertical axis represents total cost or revenues. Indicate by number which graph best fits the situation or item described (a–h). Some graphs may be used more than once; some may not apply to any of the situations. Direct material costs Supervisors’ salaries for one shift and two shifts A cost-volume-profit graph Mixed costs—for example, car rental fixed charge plus a rate per mile driven Depreciation of plant, computed on a straight-line basis Data supporting the use of a variable-cost rate, such as manufacturing labor cost of $14 per unit produced Incentive bonus plan that pays managers $0.10 for every unit produced above some level of production Interest expense on $2 million borrowed at a fixed rate of interestarrow_forwardBased on analyzing the relationship of total factory overhead (Y) to direct labor hours (X). The following relationship was found: Y = $1,000 + $2X The equation was probably found through the use of which of the following mathematical techniques?arrow_forwardThe managing director of a consulting group has the accompanying monthly data on total overhead costs and professional labor hours to bill to clients. Complete parts a through c. Click the icon to view the monthly data. a. Develop a simple linear regression model between billable hours and overhead costs. Overhead Costs +(9) x Billable Hours (Round the constant to one decimal place as needed. Round the coefficient to four decimal places as needed. Do not include the $ symbol in your answers.) X Monthly Overhead Costs and Billable Hours Data Overhead Costs Billable Hours $315,000 3,000 $360,000 4,000 $385,000 5,000 $438,000 6,000 $520,000 7,000 $540,000 8,000 D Print Donearrow_forward
 Cornerstones of Cost Management (Cornerstones Ser...AccountingISBN:9781305970663Author:Don R. Hansen, Maryanne M. MowenPublisher:Cengage Learning
 Managerial Accounting: The Cornerstone of Busines...AccountingISBN:9781337115773Author:Maryanne M. Mowen, Don R. Hansen, Dan L. HeitgerPublisher:Cengage Learning