
Videos
Interpretive Questions on the CVP Graph L06−2, L06−5
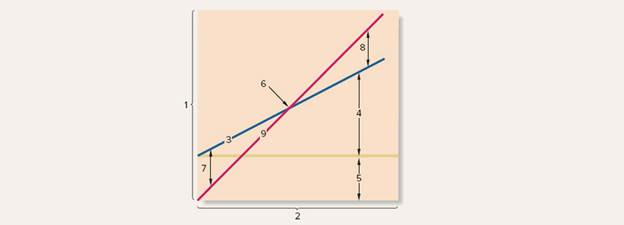
A CVP graph such as the cue shown below is a useful technique for showing relationships among an organizations costs, volume, and profits.
Required:
Identify the numbered components in the CVP graph.
2. State the effect of each of the following actions on line 3, line 9, and the break-even point. For line 3 and line 9, state whether the action will cause the line to:
Remain unchanged.
Shift upward.
Shift downward.
Have a steeper slope (i.e.. rotate upward).
Have a flatter slope (i.e., rotate downward).
Shift upward and have a steeper slope.
Shift upward and have a flatter slope.
Shift downward and have a steeper slope.
Shift downward and have a flatter slope.
In the case of the break-even point, state whether the action will cause the break-even point to:
Remain unchanged.
Increase.
Decrease.
Probably change, but the direction is uncertain.
Treat each case independently.
x. Example. Fixed expenses are reduced by $5,000 per period
Answer (see choices above): Line 3: Shift downward.
Line 9: Remain unchanged.
Break-even point Decrease.
a. The unit selling price is increased from $18 to $20.
b. Unit variable expenses are decreased from $12 to $10.
c. Fixed expenses are increased by $3,000 per period.
d. Two thousand more units are sold during the period than were budgeted.
e. Due to paying salespersons a commission rather than a flat salary, fixed expenses are reduced by $8,000 per period and unit variable
expenses are increased by $3.
f. Due to an increase in the cost of materials, both unit variable expenses and the selling price are increased by $2.
g. Advertising costs are increased by $10,000 per period; resulting in a 10% increase in the number of units sold.
h. Due to automating an operation previously done by workers, fixed expenses are increased by $12,000 per period and unit variable
expenses are reduced by $4.
Want to see the full answer?
Check out a sample textbook solution
Chapter 6 Solutions
Introduction To Managerial Accounting


- Cost Accounting Give the answer to the problem. What is the answer in numbers 1 and 2? Show solution/process.arrow_forwardQuestion Content Area Which of the following graphs in Figure 1 illustrates the behavior of a total variable cost?arrow_forwardMatching Following are a number of key terms and concepts introduced in thechapter, along with a list of corresponding definitions. Match the appropriate letter for the key term or concept to each definition provided (items 1–12). Note thatnot all key terms and concepts will be used. Answers are provided at the end of thischapter.a. Cost–volume–profit analysisb. Cost formulac. Contribution margind. Contribution margin formatincome statemente. Linearity assumptionf. Contribution margin ratiog. Operating leverageh. Sales mixi. Break-even pointj. High–low techniquek. Managerial accountingl. Management processm. Variable costn. Fixed costo. Relevant rangep. Mixed (semivariable) costq. Cost behavior pattern____ 1. The proportion of total sales represented by various products or categoriesof products.____ 2. The difference between revenues and variable costs.____ 3. The concept that operating income changes proportionately more than revenues for any given change in revenues.____ 4. The…arrow_forward
- What are the important points to remember in preparing the breakeven point graph? The cost-volume-profit (CVP) graph?arrow_forward.Which of the following is the format of the income statement that is MOST useful in decision-making? Select one: A.Contribution margin format B.Absorption costing format C.Single-step format D.Multiple-step formatarrow_forwardMatching Question: Match the following cost accounting objectives with their corresponding descriptions: A) Cost Control and Reduction B) Budgeting and Planning C) Performance Evaluation 1. Involves comparing actual costs with budgeted costs to assess efficiency. • Answer: 2. Focuses on implementing strategies to manage and minimize costs. • Answer: 3. Provides precise cost estimates for various activities, aiding in effective planning. • Answer: Match each objective with its appropriate description: A)..... B) C)arrow_forward
- 1 Responsibility centers typically involve cost, profit, and investment centers. What is the basic measure used to evaluate each of these responsibility center?arrow_forwardWhich of the following is the format of the income statement that is MOST useful in decision-making? Select one: A. Multiple-step format B. Absorption costing format C. Single-step format D. Contribution margin formatarrow_forwardSelect the correct statement concerning the cost-volume-profit graph at right: a. The point identified by "B" is the break-even point. b. Line F is the variable cost line. c. At point B, profits equal total costs. d. Line E is the total cost line. Line F Line E Line Darrow_forward
- The graph of a variable cost when plotted against its related activity base appears as a a.circle b.straight line c.rectangle d.curved linearrow_forwardObtain and study a CVP graph and answer the next multiple choice 22. Select the correct statement concerning the cost-volume-profit graph at right: a. The point identified by "B" is the break-even point. b. Line F is the variable cost line. c. At point B, profits equal total costs. d. Line E is the total cost line. Line F Line E Line Darrow_forwardCost Accounting Answer a, b, and c and provide solution.arrow_forward
 Managerial Accounting: The Cornerstone of Busines...AccountingISBN:9781337115773Author:Maryanne M. Mowen, Don R. Hansen, Dan L. HeitgerPublisher:Cengage Learning
 Principles of Cost AccountingAccountingISBN:9781305087408Author:Edward J. Vanderbeck, Maria R. MitchellPublisher:Cengage Learning
 Principles of Accounting Volume 2AccountingISBN:9781947172609Author:OpenStaxPublisher:OpenStax College
 Financial & Managerial AccountingAccountingISBN:9781337119207Author:Carl Warren, James M. Reeve, Jonathan DuchacPublisher:Cengage Learning