
a.
To determine: the probability of
The probabilities for the value of
Given information:
An average of 7 gopher holes appears on the farm shown each week.
Concept Used:
Probability:
It is the ratio of number of ways it can happen to the total number of outcomes:
Binomial Experiment Probability:
The probability of k successes in the n trials for a binomial experiment is given by
Calculation:
Let x represents the number of animal pits in the market plot.
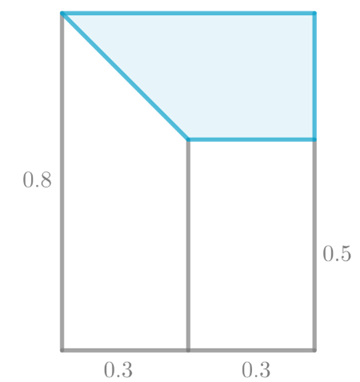
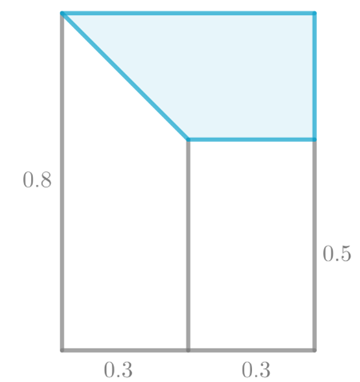
The total area of the land where the animal pits might appear is
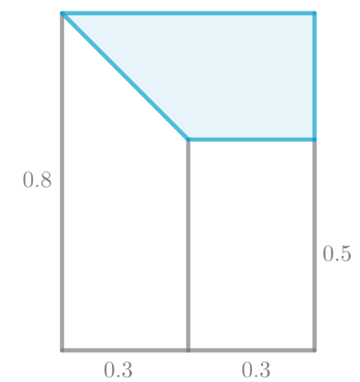
The area of the marked plot is made of a rectangle with sides 0.3 and 0.8-0.5, and a right triangle sides 0.3 and 0.8-0.5.
Therefore, the area of the plot is calculated as the sum of the areas of the rectangle and the triangle:
The general probability of a pit appearing in the plot is determine by dividing the area of the plot with the total area of the land.
Now, calculate the chance for each number of pits or for each value of x , using the formula for binomial probability distribution.
b.
To make: a table for showing the probability distribution for X.
| X | 0 | 1 | 2 | 3 | 4 | 5 | 6 | 7 |
| P(X) | 0.099 | 0.271 | 0.319 | 0.208 | 0.081 | 0.019 | 0.0025 | 0.0001 |
Given information:
An average of 7 gopher holes appears on the farm shown each week.
Concept Used:
Probability:
It is the ratio of number of ways it can happen to the total number of outcomes:
Binomial Experiment Probability:
The probability of k successes in the n trials for a binomial experiment is given by
Calculation:
From the previous part, the probabilities for the value of
| X | 0 | 1 | 2 | 3 | 4 | 5 | 6 | 7 |
| P(X) | 0.099 | 0.271 | 0.319 | 0.208 | 0.081 | 0.019 | 0.0025 | 0.0001 |
c.
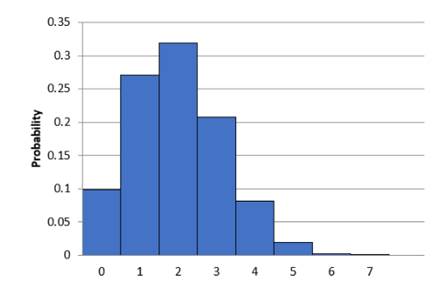
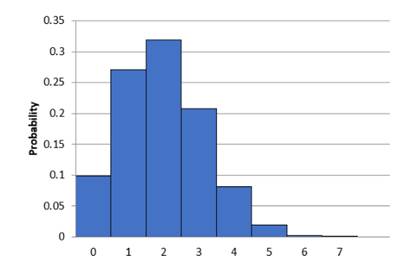
To make: a histogram for showing the probability distribution for X.
Given information:
An average of 7 gopher holes appears on the farm shown each week.
Concept Used:
Probability:
It is the ratio of number of ways it can happen to the total number of outcomes:
Binomial Experiment Probability:
The probability of k successes in the n trials for a binomial experiment is given by
Calculation:
From the previous part, the probabilities for the value of
From the previous part, the table for showing the probability distribution for X
| X | 0 | 1 | 2 | 3 | 4 | 5 | 6 | 7 |
| P(X) | 0.099 | 0.271 | 0.319 | 0.208 | 0.081 | 0.019 | 0.0025 | 0.0001 |
The histogram is shown below:
Chapter 6 Solutions
Holt Mcdougal Larson Algebra 2: Student Edition 2012
 Algebra and Trigonometry (6th Edition)AlgebraISBN:9780134463216Author:Robert F. BlitzerPublisher:PEARSON
 Contemporary Abstract AlgebraAlgebraISBN:9781305657960Author:Joseph GallianPublisher:Cengage Learning
 Linear Algebra: A Modern IntroductionAlgebraISBN:9781285463247Author:David PoolePublisher:Cengage Learning
 Algebra And Trigonometry (11th Edition)AlgebraISBN:9780135163078Author:Michael SullivanPublisher:PEARSON
 Introduction to Linear Algebra, Fifth EditionAlgebraISBN:9780980232776Author:Gilbert StrangPublisher:Wellesley-Cambridge Press
 College Algebra (Collegiate Math)AlgebraISBN:9780077836344Author:Julie Miller, Donna GerkenPublisher:McGraw-Hill Education


