
To make: A histogram for the given binomial experiment with the help of a graphing calculator and find the most likely number of success.
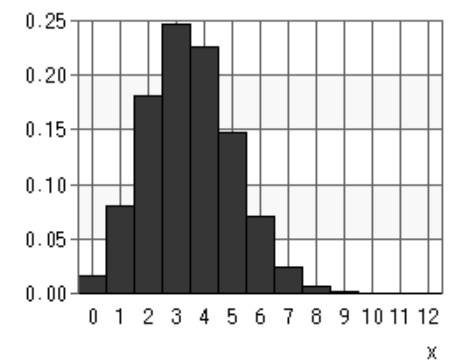
Most likely number of success is 3.
Given information:
Number of trials, and probability of success is given as follows:
Formula used:
Formula of Binomial distribution of
The most likely sum will be the
Calculation:
Use a graphing calculator to make a table for the binomial experiment.
| Binomial distribution | |
| 0 | 0.01640968274 |
| 1 | 0.08043055766 |
| 2 | 0.1806855485 |
| 3 | 0.2460037985 |
| 4 | 0.2260809557 |
| 5 | 0.1477486809 |
| 6 | 0.07040606155 |
| 7 | 0.02464920465 |
| 8 | 0.006292490623 |
| 9 | 0.001142298767 |
| 10 | 1.399718208E-4 |
| 11 | 1.039483432E-5 |
| 12 | 3.538147832E-7 |
Draw the histogram for the binomial experiment as shown:

Probability corresponding to 3 success is greatest so the most likely number of success is 3.
Chapter 6 Solutions
Holt Mcdougal Larson Algebra 2: Student Edition 2012

 Algebra and Trigonometry (6th Edition)AlgebraISBN:9780134463216Author:Robert F. BlitzerPublisher:PEARSON
 Contemporary Abstract AlgebraAlgebraISBN:9781305657960Author:Joseph GallianPublisher:Cengage Learning
 Linear Algebra: A Modern IntroductionAlgebraISBN:9781285463247Author:David PoolePublisher:Cengage Learning
 Algebra And Trigonometry (11th Edition)AlgebraISBN:9780135163078Author:Michael SullivanPublisher:PEARSON
 Introduction to Linear Algebra, Fifth EditionAlgebraISBN:9780980232776Author:Gilbert StrangPublisher:Wellesley-Cambridge Press
 College Algebra (Collegiate Math)AlgebraISBN:9780077836344Author:Julie Miller, Donna GerkenPublisher:McGraw-Hill Education