
Concept explainers
Videos
a)
To explain which one is better summary of the percentage of White residents in the neighborhoods.
a)
Answer to Problem 36E
Explanation of Solution
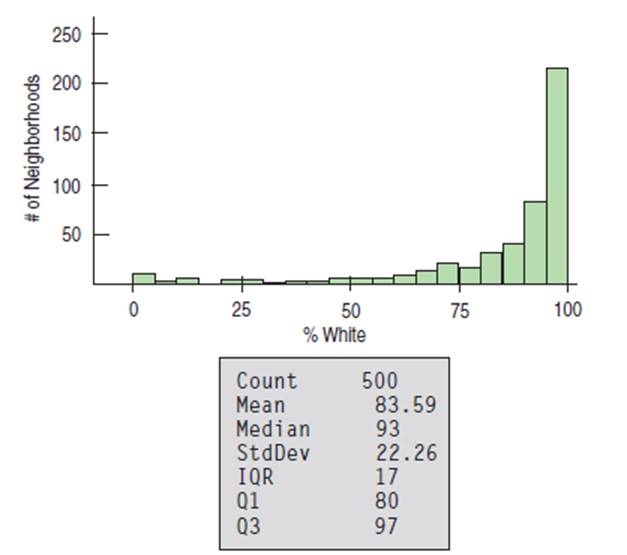
Given:

The distribution is left skewed. Therefore, when the distribution is left skewed then the
b)
To explain which one is better summary of the spread.
b)
Answer to Problem 36E
IQR.
Explanation of Solution
Given:

The distribution is left skewed. Therefore, when the distribution is left skewed then the standard deviation is highly influenced by the outlier points. Hence, IQR would better summary statistics as it is more resistant to skewed effects.
c)
To find the percent of neighborhood within 1 standard deviation.
c)
Answer to Problem 36E
The 68% of the values are within 1 standard deviation of the mean.
Explanation of Solution
Given:

According to rule of 68-95-99.7, the 68% of the values are within 1 standard deviation of the mean.
d)
To find the actual percent of neighborhood within 1 standard deviation.
d)
Answer to Problem 36E
More than 80% of the values are within 1 standard deviation of the mean.
Explanation of Solution
Given:

Form Histogram, more than 80% of the neighborhoods have a white percentage greater than 61.33%. Therefore, about 80% of the data lies within 1 standard deviation from the mean.
e)
To explain discrepancy between part c and part d.
e)
Answer to Problem 36E
The assumptions of Normal model do not fit so there is discrepancy between part c and d.
Explanation of Solution
Given:
As we know, the distribution is left skewed and we can not use Normal model for this distribution. That’s why there is discrepancy between part c and d.
Chapter 6 Solutions
Stats: Modeling the World Nasta Edition Grades 9-12
Additional Math Textbook Solutions
Statistics: The Art and Science of Learning from Data (4th Edition)
Introductory Statistics
Elementary Statistics (13th Edition)
Elementary Statistics
Statistics for Psychology
Essentials of Statistics, Books a la Carte Edition (5th Edition)


 MATLAB: An Introduction with ApplicationsStatisticsISBN:9781119256830Author:Amos GilatPublisher:John Wiley & Sons Inc
 Probability and Statistics for Engineering and th...StatisticsISBN:9781305251809Author:Jay L. DevorePublisher:Cengage Learning
 Statistics for The Behavioral Sciences (MindTap C...StatisticsISBN:9781305504912Author:Frederick J Gravetter, Larry B. WallnauPublisher:Cengage Learning
 Elementary Statistics: Picturing the World (7th E...StatisticsISBN:9780134683416Author:Ron Larson, Betsy FarberPublisher:PEARSON
 The Basic Practice of StatisticsStatisticsISBN:9781319042578Author:David S. Moore, William I. Notz, Michael A. FlignerPublisher:W. H. Freeman
 Introduction to the Practice of StatisticsStatisticsISBN:9781319013387Author:David S. Moore, George P. McCabe, Bruce A. CraigPublisher:W. H. Freeman