
Concept explainers
Videos
a)
To draw the model which shows 68-95-99.7
a)
Explanation of Solution
Given:
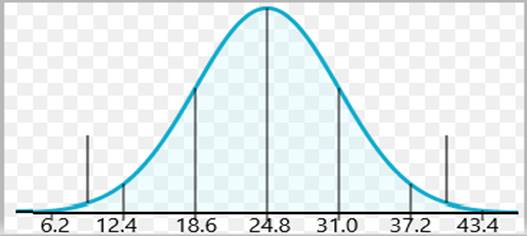
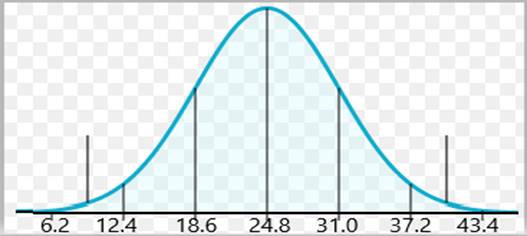
Following is the model which shows 68-95-99.7:
b)
To find the interval in which 68% of autos to be found.
b)
Answer to Problem 25E
The central 68% of autos can be found between 18.6 mpg and 31.0 mpg
Explanation of Solution
Given:
According to rule of 68-95-99.7, the 68% of the values are within 1 standard deviation of the
Therefore,
Hence, the central 68% of autos can be found between 18.6 mpg and 31.0 mpg.
c)
To find the percent of autos should get more than 31 mpg.
c)
Answer to Problem 25E
The 16% of autos should get more than 31 mpg.
Explanation of Solution
Given:
The central 68% of autos can be found between 18.6 mpg and 31.0 mpg.
According to rule, 31 is 1 standard deviation above the mean. Therefore, when data is in total 100%, 32% of the data is then more than 1 standard deviation from the mean. We know, the normal curve is symmetric about the mean then 16% is more than 1 standard deviation below the mean and 16% is more than 1 standard deviation above the mean. So, we can say, 16% of autos should get more than 31 mpg.
d)
To find the percent of cars should bet between 31 and 37.2 mpg
d)
Answer to Problem 25E
The 13.5% of cars should get between 31 and 37.2 mpg.
Explanation of Solution
Given:

According to rule, 31 is 1 standard deviation above the mean. As per graph,37.2 is 2 standard deviation above the mean. Therefore, 95%-68% = 27% which is more than 1 standard deviation and less than 2 standard deviation of the mean. We know, the normal curve is symmetric about the mean then 13.5% is more than 1 standard deviation but less than 2 standard deviation below the mean and 13.5% is more than 1 standard deviation but less than 2 standard deviationabove the mean. So, we can say, 13.5% of cars should get between 31 and 37.2 mpg.
e)
To explain the gas mileage of the worst 2.5% of all cars.
e)
Answer to Problem 25E
The worst 2.5% have a gas mileage less than 12.4 mpg.
Explanation of Solution
Given:
According to rule, 95% of the data lies between 2 standard deviations from the mean. Since, total data is 100%, so 5% of the data is the more than 2 standard deviations from the mean. Therefore, as per symmetry, 2.5% is more than 2 standard deviations below the mean and 2.5% is more than 2 standard deviations above the mean.
Therefore, the worst 2.5% have a gas mileage less than 12.4 mpg.
Chapter 6 Solutions
Stats: Modeling the World Nasta Edition Grades 9-12
Additional Math Textbook Solutions
Statistics: The Art and Science of Learning from Data (4th Edition)
Introductory Statistics
Elementary Statistics (13th Edition)
Elementary Statistics Using Excel (6th Edition)
Introductory Statistics (2nd Edition)
Elementary Statistics


 MATLAB: An Introduction with ApplicationsStatisticsISBN:9781119256830Author:Amos GilatPublisher:John Wiley & Sons Inc
 Probability and Statistics for Engineering and th...StatisticsISBN:9781305251809Author:Jay L. DevorePublisher:Cengage Learning
 Statistics for The Behavioral Sciences (MindTap C...StatisticsISBN:9781305504912Author:Frederick J Gravetter, Larry B. WallnauPublisher:Cengage Learning
 Elementary Statistics: Picturing the World (7th E...StatisticsISBN:9780134683416Author:Ron Larson, Betsy FarberPublisher:PEARSON
 The Basic Practice of StatisticsStatisticsISBN:9781319042578Author:David S. Moore, William I. Notz, Michael A. FlignerPublisher:W. H. Freeman
 Introduction to the Practice of StatisticsStatisticsISBN:9781319013387Author:David S. Moore, George P. McCabe, Bruce A. CraigPublisher:W. H. Freeman