
Concept explainers
Videos
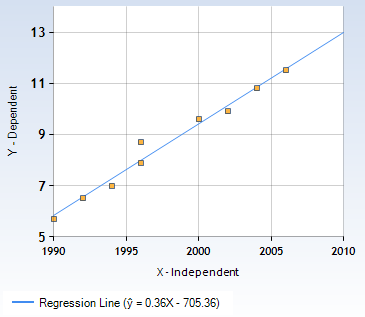
To find: The relationship, depicted by
Answer to Problem 10PPE
Scatter plot of the data given is shown below:

It shows trend line and equation of this tread line is
Explanation of Solution
Given information: The below table shows the data related to average price and number sold.
| Years | 1990 | 1992 | 1994 | 1996 | 1998 | 2000 | 2002 | 2004 | 2006 |
| Revenue | 5.7 | 6.5 | 7.0 | 7.9 | 8.7 | 9.6 | 9.9 | 10.8 | 11.5 |
Concept used: In XY coordinate plane, years is represented on horizontal x axis and revenue ( in billions dollars) is represented on vertical y axis..
Calculation: Two data sets, on plotting in XY plane, show the related scattered plot as:
And as in year 2004, attendance is 328 and in 2006, it is 335, so estimated attendance in year 2005 will be 330 million.
Conclusion: Scatter plot shows that there is a strong
Chapter 5 Solutions
High School Math 2015 Common Core Algebra 1 Student Edition Grade 8/9
Additional Math Textbook Solutions
College Algebra with Modeling & Visualization (5th Edition)
Graphical Approach To College Algebra
Introductory and Intermediate Algebra for College Students (5th Edition)
Linear Algebra with Applications (9th Edition) (Featured Titles for Linear Algebra (Introductory))
PREALGEBRA


 Algebra and Trigonometry (6th Edition)AlgebraISBN:9780134463216Author:Robert F. BlitzerPublisher:PEARSON
 Contemporary Abstract AlgebraAlgebraISBN:9781305657960Author:Joseph GallianPublisher:Cengage Learning
 Linear Algebra: A Modern IntroductionAlgebraISBN:9781285463247Author:David PoolePublisher:Cengage Learning
 Algebra And Trigonometry (11th Edition)AlgebraISBN:9780135163078Author:Michael SullivanPublisher:PEARSON
 Introduction to Linear Algebra, Fifth EditionAlgebraISBN:9780980232776Author:Gilbert StrangPublisher:Wellesley-Cambridge Press
 College Algebra (Collegiate Math)AlgebraISBN:9780077836344Author:Julie Miller, Donna GerkenPublisher:McGraw-Hill Education