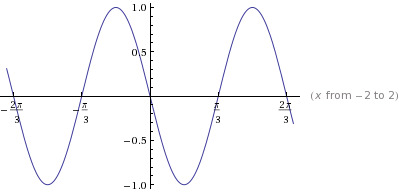
To sketch; the graph of given function and calculate its amplitude, period and phase shift.
Answer to Problem 42E
See the graph.
Explanation of Solution
The graph can be drawn by replacing y values with the x values. After that, the corresponding x and y values need to be calculated and paired. Now, plot all the coordinated points and join them with lines. This graph can also be drawn by drawing the base graph and then the appropriate phase shifting.

In the above graph a phase shift of
The amplitude is equivalent to the coefficient’s absolute value in a trigonometric function. In the given case
The period can be calculated by considering the coefficient of
Chapter 5 Solutions
Precalculus: Mathematics for Calculus - 6th Edition
 Calculus: Early TranscendentalsCalculusISBN:9781285741550Author:James StewartPublisher:Cengage Learning
 Thomas' Calculus (14th Edition)CalculusISBN:9780134438986Author:Joel R. Hass, Christopher E. Heil, Maurice D. WeirPublisher:PEARSON
 Calculus: Early Transcendentals (3rd Edition)CalculusISBN:9780134763644Author:William L. Briggs, Lyle Cochran, Bernard Gillett, Eric SchulzPublisher:PEARSON
 Calculus: Early TranscendentalsCalculusISBN:9781319050740Author:Jon Rogawski, Colin Adams, Robert FranzosaPublisher:W. H. Freeman
 Calculus: Early Transcendental FunctionsCalculusISBN:9781337552516Author:Ron Larson, Bruce H. EdwardsPublisher:Cengage Learning


