
Videos
a.
Sketch a
a.
Answer to Problem 3P
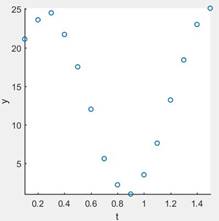
The scatter plot is
Explanation of Solution
Given: A set of the data is,
Calculation:
Let’s take a given data set sketch a scatter plot using MATLAB.
The function is using in the MATLAB to sketch a scatter plot is,
Program:
clc
clear
close all
t=[0.1 0.2 0.3 0.4 0.5 0.6 0.7 0.8 0.9 1.0 1.1 1.2 1.3 1.4 1.5];
y=[21.1 23.6 24.5 21.7 17.5 12.0 5.6 2.2 1.0 3.5 7.6 13.2 18.4 23.0 25.1];
scatter(t,y,'linewidth',1.25');
set(gca,'Linewidth',1.2,'Fontsize',12);
xlabel('t');
ylabel('y')
axis square
axis tight
Query:
- First, we have defined the given data sets.
- Then using a function “scatter (t, y)” sketch a scatter plot.
b.
Calculate the cosine function using given data set.
b.
Answer to Problem 3P
The cosine function is,
Explanation of Solution
Given: A set of the data is,
Calculation:
First, we have to write a general equation of the cosine function,
Then, calculate the vertical shifting as,
Calculate the amplitude as,
Then, Calculate the phase shift as,
The value of c is,
Put all the value into the equation (1) then,
Program:
clc
clear
close all
t=[0.1 0.2 0.3 0.4 0.5 0.6 0.7 0.8 0.9 1.0 1.1 1.2 1.3 1.4 1.5];
y=[21.1 23.6 24.5 21.7 17.5 12.0 5.6 2.2 1.0 3.5 7.6 13.2 18.4 23.0 25.1];
b=(1/2)*(max(y)+min(y));
a=(1/2)*(max(y)-min(y));
w=2*pi/max(t);
idx=find(y==max(y));
c=t(idx);
f=(a*cos(w*(t-c)))+b;
Query:
- First, we have defined the given data sets.
- Then calculate the value of b, a, w, and c.
- Put all the values into the equation of cosine function and get the solution.
c.
Sketch a graph of the function which is found in part (b).
c.
Answer to Problem 3P
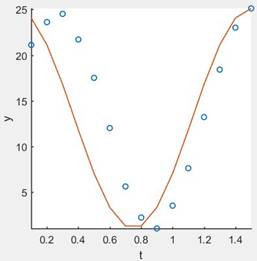
The solution is,
Explanation of Solution
Given: A set of the data is,
Calculation:
Sketch a graph of the cosine function in MATLAB using function “plot (f, t)”.
The function is found in part (b) is,
Program:
clc
clear
close all
t=[0.1 0.2 0.3 0.4 0.5 0.6 0.7 0.8 0.9 1.0 1.1 1.2 1.3 1.4 1.5];
y=[21.1 23.6 24.5 21.7 17.5 12.0 5.6 2.2 1.0 3.5 7.6 13.2 18.4 23.0 25.1];
b=(1/2)*(max(y)+min(y));
a=(1/2)*(max(y)-min(y));
w=2*pi/max(t);
idx=find(y==max(y));
c=t(idx);
f=(a*cos(w*(t-c)))+b;
scatter(t,y,'linewidth',1.25');
hold on
plot(t,f,'linewidth',1.25');
set(gca,'Linewidth',1.2,'Fontsize',12);
xlabel('t');
ylabel('y')
axis square
axis tight
Query:
- First, we have defined the given data sets.
- Then calculate the value of b, a, w, and c.
- Put all the values into the equation of cosine function and get the solution.
- Then sketch a graph.
d.
Calculate the sine function using given data set.
d.
Answer to Problem 3P
The cosine function is,
Explanation of Solution
Given: A set of the data is,
Calculation:
First, we have to write a general equation of the cosine function,
Then, calculate the vertical shifting as,
Calculate the amplitude as,
Then, Calculate the phase shift as,
The value of c is,
Put all the value into the equation (1) then,
Program:
clc
clear
close all
t=[0.1 0.2 0.3 0.4 0.5 0.6 0.7 0.8 0.9 1.0 1.1 1.2 1.3 1.4 1.5];
y=[21.1 23.6 24.5 21.7 17.5 12.0 5.6 2.2 1.0 3.5 7.6 13.2 18.4 23.0 25.1];
b=(1/2)*(max(y)+min(y));
a=(1/2)*(max(y)-min(y));
w=2*pi/max(t);
idx=find(y==max(y));
c=t(idx);
f=(a*sin(w*(t+c)))+b;
Query:
- First, we have defined the given data sets.
- Then calculate the value of b, a, w, and c.
- Put all the values into the equation of cosine function and get the solution.
e.
Compare the results from part (b) and (c).
e.
Answer to Problem 3P
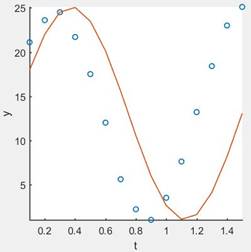
Using reduction relation, the graph of the given data is,
Explanation of Solution
Given: the reduction formula,
Calculation:
As we can see in part (d) the sine function is,
Where,
Then rewrite the function as,
Simplify the above function and sketch a graph.
Program:
clc
clear
close all
t=[0 25 50 75 100 125 150 175 200 225 250 275 300 325 350];
y=[190 175 155 125 110 95 105 120 140 165 185 200 195 185 165];
b=(1/2)*(max(y)+min(y));
a=(1/2)*(max(y)-min(y));
w=2*pi/max(t);
idx=find(y==max(y));
c=t(idx);
f=(a*cos(w*(t+c)-pi/2))+b;
scatter(t,y,'linewidth',1.25');
hold on
plot(t,f,'linewidth',1.25');
set(gca,'linewidth',1.2,'fontsize',12);
xlabel('t');
ylabel('y')
axis square
axis tight
Query:
- First, we have defined the given data sets.
- Then calculate the value of b, a, w, and c.
- Then using reduction relation redefine the function.
- Sketch a graph.
Chapter 5 Solutions
Precalculus: Mathematics for Calculus - 6th Edition


 Calculus: Early TranscendentalsCalculusISBN:9781285741550Author:James StewartPublisher:Cengage Learning
 Thomas' Calculus (14th Edition)CalculusISBN:9780134438986Author:Joel R. Hass, Christopher E. Heil, Maurice D. WeirPublisher:PEARSON
 Calculus: Early Transcendentals (3rd Edition)CalculusISBN:9780134763644Author:William L. Briggs, Lyle Cochran, Bernard Gillett, Eric SchulzPublisher:PEARSON
 Calculus: Early TranscendentalsCalculusISBN:9781319050740Author:Jon Rogawski, Colin Adams, Robert FranzosaPublisher:W. H. Freeman
 Calculus: Early Transcendental FunctionsCalculusISBN:9781337552516Author:Ron Larson, Bruce H. EdwardsPublisher:Cengage Learning