
Concept explainers
Videos
a.
Sketch a
a.
Answer to Problem 7P
The scatter plot is
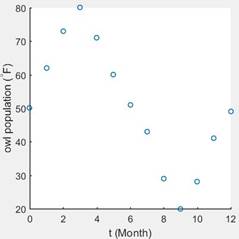
Explanation of Solution
Given: A set of the data is,
Calculation:
Let’s take a given data set sketch a scatter plot using MATLAB.
The function is using in the MATLAB to sketch a scatter plot is,
Program:
clc
clear
close all
t=[1 2 3 4 5 6 7 8 9 10 11 12];
y=[40.0 43.1 54.6 64.2 73.8 81.8 85.8 83.9 76.9 66.8 55.5 44.5];
scatter(t,y,'linewidth',1.25');
set(gca,'Linewidth',1.2,'Fontsize',12);
xlabel('t (Month)');
ylabel('Average temperature (^{\circ}F)')
axis square
axis tight
Query:
- First, we have defined the given data sets.
- Then using a function “scatter (t, y)” sketch a scatter plot.
b.
Calculate the cosine function using given data set.
b.
Answer to Problem 7P
The cosine function is,
Explanation of Solution
Given: A set of the data is,
Calculation:
First, we have to write a general equation of the cosine function,
Then, calculate the vertical shifting as,
Calculate the amplitude as,
Then, Calculate the phase shift as,
The value of c is,
Put all the value into the equation (1) then,
Program:
clc
clear
close all
t=[0 1 2 3 4 5 6 7 8 9 10 11 12];
y=[50 62 73 80 71 60 51 43 29 20 28 41 49];
b=(1/2)*(max(y)+min(y));
a=(1/2)*(max(y)-min(y));
w=2*pi/max(t);
idx=find(y==max(y));
c=t(idx);
f=(a*cos(w*(t-c)))+b;
Query:
- First, we have defined the given data sets.
- Then calculate the value of b, a, w, and c.
- Put all the values into the equation of cosine function and get the solution.
c.
Sketch a graph of the function which is found in part (b).
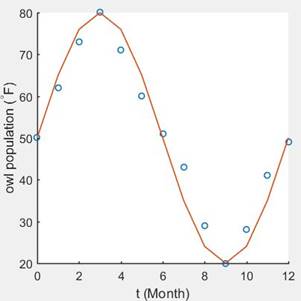
c.
Answer to Problem 7P
The solution is,
Explanation of Solution
Given: A set of the data is,
Calculation:
Sketch a graph of the cosine function in MATLAB using function “plot (f, t)”.
The function is found in part (b) is,
Program:
clc
clear
close all
t=[1 2 3 4 5 6 7 8 9 10 11 12];
y=[40.0 43.1 54.6 64.2 73.8 81.8 85.8 83.9 76.9 66.8 55.5 44.5];
b=(1/2)*(max(y)+min(y));
a=(1/2)*(max(y)-min(y));
w=2*pi/max(t);
idx=find(y==max(y));
c=t(idx);
f=(a*cos(w*(t-c)))+b;
scatter(t,y,'linewidth',1.25');
hold on
plot(t,f,'linewidth',1.25');
set(gca,'Linewidth',1.2,'Fontsize',12);
xlabel('t (Month)');
ylabel('Average temperature (^{\circ}F)')
axis square
axis tight
Query:
- First, we have defined the given data sets.
- Then calculate the value of b, a, w, and c.
- Put all the values into the equation of cosine function and get the solution.
- Then sketch a graph.
d.
Calculate the sine function using given data set.
d.
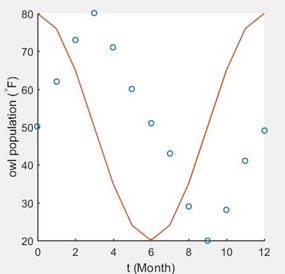
Answer to Problem 7P
The cosine function is,
And the best fitting curve is,
Explanation of Solution
Given: A set of the data is,
Calculation:
First, we have to write a general equation of the cosine function,
Then, calculate the vertical shifting as,
Calculate the amplitude as,
Then, Calculate the phase shift as,
The value of c is,
Put all the value into the equation (1) then,
Program:
clc
clear
close all
t=[1 2 3 4 5 6 7 8 9 10 11 12];
y=[40.0 43.1 54.6 64.2 73.8 81.8 85.8 83.9 76.9 66.8 55.5 44.5];
b=(1/2)*(max(y)+min(y));
a=(1/2)*(max(y)-min(y));
w=2*pi/max(t);
idx=find(y==max(y));
c=t(idx);
f=(a*sin(w*(t+c)))+b;
scatter(t,y,'linewidth',1.25');
hold on
plot(t,f,'linewidth',1.25');
set(gca,'Linewidth',1.2,'Fontsize',12);
xlabel('t (Month)');
ylabel('Average temperature (^{\circ}F)')
axis square
axis tight
Query:
- First, we have defined the given data sets.
- Then calculate the value of b, a, w, and c.
- Put all the values into the equation of cosine function and get the solution.
- Then sketch a best fitting curve with the scatter plot.
Chapter 5 Solutions
Precalculus: Mathematics for Calculus - 6th Edition


- Hi, can you guys help me with this? Thank you! Can you guys help me calculate again the Term GPA, Combined GPA, Cumulative GPA, Transfer GPA & Combined Cumulative GPA section? It's just not right right now. Here's the transfer totals point that I want to provide just in case you guys may ask where I get these from:arrow_forwardUse undetermined coefficients to find the particular solution to y"-3y+2y=4e3 Y(t) =arrow_forwardPlease refer belowarrow_forward
- The graph of f(x) is given in the figure below. draw tangent lines to the graph at x=-3,x=-2,x=1,and x=4. estimate f'(-3),f'(-2),f'(1),and f'(4). Round your answers to one decimal place.arrow_forwardConsider the functions f(x)=4x-1 and g(x)=sq root of -x+7. Determine 1. f o g(x) 2. Give the domain of f o g(x) 3. g o f (x) 4. Give the domain of g o f(x)arrow_forward12. lim h→0 √5x+5h -√5x h where x>0 is constaarrow_forward
 Calculus: Early TranscendentalsCalculusISBN:9781285741550Author:James StewartPublisher:Cengage Learning
 Thomas' Calculus (14th Edition)CalculusISBN:9780134438986Author:Joel R. Hass, Christopher E. Heil, Maurice D. WeirPublisher:PEARSON
 Calculus: Early Transcendentals (3rd Edition)CalculusISBN:9780134763644Author:William L. Briggs, Lyle Cochran, Bernard Gillett, Eric SchulzPublisher:PEARSON
 Calculus: Early TranscendentalsCalculusISBN:9781319050740Author:Jon Rogawski, Colin Adams, Robert FranzosaPublisher:W. H. Freeman
 Calculus: Early Transcendental FunctionsCalculusISBN:9781337552516Author:Ron Larson, Bruce H. EdwardsPublisher:Cengage Learning