
Concept explainers
Videos
(a)
To write: An equation to model the percent of the motor vehicles produced in the United States as a function of the number of years since 1950.
(a)
Answer to Problem 67E
P=−1.074t+75.7
Explanation of Solution
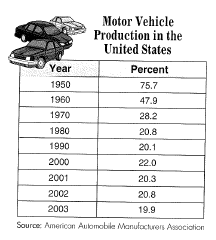
Given information: Manufacturing: The percent of the motor vehicles produced in the United States since 1950 is depicted in the table given below.
Calculation:
We need to find y=mx+b . Pick two years to use as point to find the slope. I picked 1950 as year 0, that way any year past that is just a one or two digit number.
So 1950 as a (x,y) pair becomes (0,75.7) .
I also picked the year 2000, so it is 50 years since 1950 and it’s (x,y) becomes (50,22) .
The year 1950 (0,75.7) and the year 2000 (50,22)
Find the slope
y2−y1x2−x1=22−75.750−0=−53.750=−1.074 This is our slope “ m ”.
We know the y intercept.
At x=0(1950)y=75.7
So our equation is
y=−1.074x+75.7
We had used a point to find b . we might get a slightly different answer.
Let’s us the (50,22) point we used in slope equation. y=mx+b becomes
22=−1.074×(50)+b which is 22=−53.7+b and solving for b gives us
b=75.7,
So it worked out.
It may not work out for all points we could have chosen.
Since this is a real life description, it is unlikely the decrease in percent of motor vehicles went down the exact amount each decade. Notice the end of the chart switches to single years after 2000. If we had used one of those points we might really see some problems.
It is not a proper chart (or graph) that changes the intervals in the data in the middle of the chart.
Let’s change the x and y to reflect the reality of our problem. Replace y with P for percent of motor vehicles produced and x with t for the number of years since 1950.
P=−1.074t+75.7
(b)
To find:percent of motor vehicles will be produced in the United States in the year 2010, according to the equation.
(b)
Answer to Problem 67E
11.26 percent
Explanation of Solution
Given information: Manufacturing: The percent of the motor vehicles produced in the United States since 1950 is depicted in the table given below.

Calculation:
P=−1.074t+75.7
We want to know the percent in 2010 which means t = 60
P=−1.074×60+75.7=−64.44+75.7=11.26
Hence,
11.26 percent
Chapter 5 Solutions
Advanced Mathematical Concepts: Precalculus with Applications, Student Edition
Additional Math Textbook Solutions
Calculus: Early Transcendentals (2nd Edition)
Elementary Statistics: Picturing the World (7th Edition)
Algebra and Trigonometry (6th Edition)
College Algebra with Modeling & Visualization (5th Edition)
Basic Business Statistics, Student Value Edition
Pre-Algebra Student Edition


- Please focus on ix.arrow_forwardPlease focus on vi.arrow_forward的 v If A is an n x n matrix that is not invertible, then A. rank(A) = n C. det(A) = 0 B. Reduced row-echelon form of A = In D. AB BA= In for some matrix B 63°F Partly sunny Q Search 3 $ 4 40 FS 96 S W E A S T FG S Y & コ B ㅁ F G H J 4 Z X C V B N M 9 H V FIB - FIB ㅁ P L ว DELETE BACHSPACE LOCK L ? PAUSE ALT CTRL ENTER 7 2:20 PM 4/14/2025 HOME J INSERT SHIFT END 5arrow_forward
 Calculus: Early TranscendentalsCalculusISBN:9781285741550Author:James StewartPublisher:Cengage Learning
 Thomas' Calculus (14th Edition)CalculusISBN:9780134438986Author:Joel R. Hass, Christopher E. Heil, Maurice D. WeirPublisher:PEARSON
 Calculus: Early Transcendentals (3rd Edition)CalculusISBN:9780134763644Author:William L. Briggs, Lyle Cochran, Bernard Gillett, Eric SchulzPublisher:PEARSON
 Calculus: Early TranscendentalsCalculusISBN:9781319050740Author:Jon Rogawski, Colin Adams, Robert FranzosaPublisher:W. H. Freeman
 Calculus: Early Transcendental FunctionsCalculusISBN:9781337552516Author:Ron Larson, Bruce H. EdwardsPublisher:Cengage Learning