
Life: The Science of Biology
11th Edition
ISBN: 9781319010164
Author: David E. Sadava, David M. Hillis, H. Craig Heller, Sally D. Hacker
Publisher: W. H. Freeman
expand_more
expand_more
format_list_bulleted
Concept explainers
Videos
Question
Chapter 47, Problem 4Q
Summary Introduction
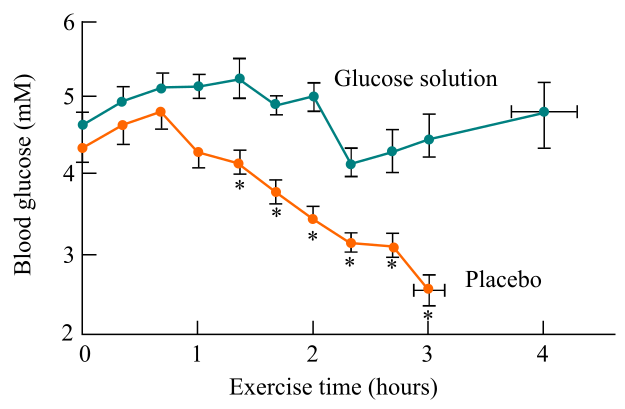
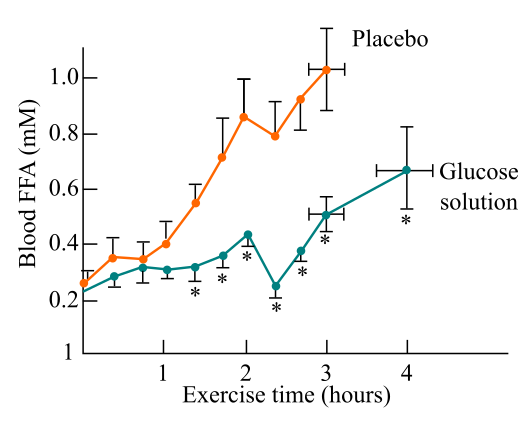
To review: the blood FFA levels in the groups provided and the overall effects of feeding the glucose on the
Given:
The graph below shows the data of glucose and placebo levels in the blood with respect to the exercise time:
The blood FFA levels on the placebo and glucose solution are shown below:
Introduction:
Free fatty acids are basically the prime fat fuel present in the body and when these get increased in the blood then they are known to increase the risk of heart problems and it may be by causing the insulin resistance and increasing the pressure of the blood.
Expert Solution & Answer
Want to see the full answer?
Check out a sample textbook solution
Students have asked these similar questions
With the aid of a diagram describe the control of blood glucose levels in the fasting state and post consumption.
What information can be inferred from this graph?
rate of inherent mechanisms at which excess glucose is removed from blood
average rate of excess glucose absorption and transport in blood
rate of utilization of glucose by the tissues
average blood glucose levels over a period of past two to 3 months
Diabetic vs Optimal Blood Sugar Levels
300
250
200
150
100
50
Waking
Breakfast
1:00
1:30
2:00
0:30
Individual A
Time
Individual B
Sleeping
The graph above shows the blood sugar levels of two patients. Which of the following statements correctly describes what is happening in this graph?
Select one:
a. If both individuals exercised heavily 2 hrs after lunch, their blood glucose levels would drop to 30 mg/dL.
b. Individual A needs to take glucagon to restore their blood glucose level after exercise.
O c. Glucagon caused the drop in blood glucose levels after meals in both individuals.
d. Insulin caused the drop in glucose in individual B about 45 minutes after breakfast.
mg/dL
0:30
Lunch
Dinner
Chapter 47 Solutions
Life: The Science of Biology
Knowledge Booster


Learn more about
Need a deep-dive on the concept behind this application? Look no further. Learn more about this topic, biology and related others by exploring similar questions and additional content below.Similar questions
- Insulin and diet A study published in the Journal of theAmerican Medical Association examined people to see if they showed any signs of IRS (insulin resistance syn-drome) involving major risk factors for Type 2 diabetes and heart disease. Among 102 subjects who consumeddairy products more than 35 times per week, 24 wereidentified with IRS. In comparison, IRS was identified in85 of 190 individuals with the lowest dairy consumption,fewer than 10 times per week.a) Is this strong evidence that IRS risk is different inpeople who frequently consume dairy products thanin those who do not?b) Does this indicate that diary consumption influencesthe development of IRS? Explain.arrow_forward300 Diabetic vs Optimal Blood Sugar Levels 250 * 200 150 100 50 0:30 0 1:0 1:30 Waking 2:00 Lunch Dinner 1:00 Time The graph above shows the blood sugar levels of two patients. Which of the following statements correctly describes what is happening in this graph? 1:30 Individual A Sleeping Individual B Select one: a. If both individuals exercised heavily 2 hrs after lunch, their blood glucose levels would drop to 30 mg/dL. b. Individual A needs to take glucagon to restore their blood glucose level after exercise. c. Glucagon caused the drop in blood glucose levels after meals in both individuals. d. Insulin caused the drop in glucose in individual B about 45 minutes after breakfast. Breakfast 2:00arrow_forwardAccording to Hall et al., REE is the rate of energy expenditure at rest and comprises approximately two-thirds of energy expenditure. True Falsearrow_forward
- Discuss the concepts “top-down and bottom-up” approaches to remedy low blood sugar levels. Be sure to discuss what metabolic pathways you know of at this point to facilitate these processes.arrow_forwardBased on the result in the test, identify which of these tests are important basis for determining glucose levels of diabetic patients from blood and/or urine and how is a modern method used glucose monitoring different? (Qualitative Analysis of Carbohydrates)arrow_forwardPart 3: Blood sugar levels of a person with diabetes mellitus and a person without were monitored over a period of 12 h. Both ate an identical meal and performed 1 h of similar exercise. Use the data in Figure 1 to answer the questions below. Farzin: mass 70 kg non-diabetic Bill: mass 70 kg diabetic W X normal range period of exercise Z low 2 6 8 10 12 Time (h) Figure 1 Blood sugar was monitored over 12 h. Blood Sugar Levels high 0.1% -arrow_forward
- please explan each question in detail and please do not copy any thing form internet please 1,What are diet pills / diet? 2,Do these pills/diet result in effective short term and long-term weight loss? why OR why not. 3,what health risks are associated with these types of pills/diet. 4,Risk / benefit associated withthese types of weight loss pills. 5,What effect does the low-calorie diet have on metabolism? 6,How are these factors effecting society? 7,why and when to change your diet, it's important to know how the cells in your body will react to the introduction of new substances or the removal of other substance. 8,Help me understand how i can incorporate any changes i made into your everyday life 9,What important factor would i make to aware of regrading the use of weight loss pill 10, the dangers of extremely low-calorie diet and to promote healthy eating habits and to maintain a healthy weight.arrow_forwardIn the large combination study of dietary cholesterol and total serum cholesterol (TC) Consumption did not affect TC because it is synthesized Consumption of dietary cholesterol had an effect when total consumption was low O Increasing consumption only had effects at high levels of consumption At all levels of consumption, increasing consumption increased TCarrow_forwardTable 3: Insulin and Glucagon Concentration in Blood Plasma Insulin (pmol/I) Glucagon (pmol/l) Insulin/Glucagon Ratio Sub. 1 Sub. 2 Sub. 3 Average Sub. 1 Sub. 2 Sub. 3 Average Fasting 56 74 72 67 37 35 34 35 Immediately post meal 100 102 88 97 36 34 34 35 [0 hour] 1 hr post meal 170 164 176 170 30 31 29 30 0.0 2 hr post meal 126 141 144 137 34 33 34 34 3 hr post meal 66 74 85 75 33 33 36 34 Equations (fx) Use these formulas for making your calculations. Round your answer to the nearest tenth. Averages Add the values from the three subjects; divide by three. Ratio Divide the insulin average by the glucagon average from 1 hr post meal.arrow_forward
- According to Hall et al., it is recommended that the 3500 kcal per pound rule no longer be utilized during weight loss. True Falsearrow_forwardTable 3: Insulin and Glucagon Concentration in Blood Plasma Insulin (pmol/I) Glucagon (pmol/I) Insulin/Glucagon Sub. 1 Sub. 2 Sub. 3 Average Sub. 1 Sub. 2 Sub. 3 Average Ratio Fasting 56 74 72 67 37 35 34 35 Immediately post meal 100 102 88 97 36 34 34 35 [0 hour] 1 hr post meal 170 164 176 170 30 31 29 30 0.0 2 hr post meal 126 141 144 137 34 33 34 34 3 hr post meal 66 74 85 75 33 33 36 34 Equations (fx) Use these formulas for making your calculations. Round your answer to the nearest tenth. Averages Add the values from the three subjects; divide by three. Ratio Divide the insulin average by the glucagon average from 1 hr post meal.arrow_forwardIf 85% of diabetic patients are correctly identified by a urine test for glucose, but 25% of non-diabetic patients are false-positives by this test, then the urine test for glucose has: a sensitivity of 85%, and a specificity of 75% a sensitivity of 25%, and a specificity of 85% a sensitivity of 75%, and a specificity of 85% a sensitivity of 15%, and a specificity of 25% a sensitivity of 75%, and a specificity of 15%arrow_forward
arrow_back_ios
SEE MORE QUESTIONS
arrow_forward_ios
Recommended textbooks for you
 Essentials of Pharmacology for Health ProfessionsNursingISBN:9781305441620Author:WOODROWPublisher:Cengage
 Human Physiology: From Cells to Systems (MindTap ...BiologyISBN:9781285866932Author:Lauralee SherwoodPublisher:Cengage Learning
Essentials of Pharmacology for Health Professions
Nursing
ISBN:9781305441620
Author:WOODROW
Publisher:Cengage
Human Physiology: From Cells to Systems (MindTap ...
Biology
ISBN:9781285866932
Author:Lauralee Sherwood
Publisher:Cengage Learning
Nutrition and Diet - GCSE Biology (9-1); Author: Mr Exham Biology;https://www.youtube.com/watch?v=SFE1DfAlipo;License: Standard Youtube License