
Videos
(a)
To explain: The type of angled formed when a vertical line is drawn at any point on the graph.
(a)
Answer to Problem 54PPS
The
Explanation of Solution
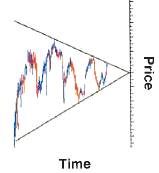
Given information: The given chart is given below.

Both lines represent highs and lows of a stock converging on the same price. The top side would be a reflection of the bottom side as triangle is symmetrical. Hence, both segments are congruent and triangle is isosceles. The
Therefore, the triangle is acute.
(b)
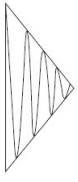
To find: The pattern of price fluctuation for the data to obtuse an obtuse triangle.
(b)
Explanation of Solution
Given information: The given chart is given below.
The difference between high and low prices of stock is known as fluctuation. If it decreases quickly over a short time of period then, it will form an obtuse angle, as shown in following diagram.
Chapter 4 Solutions
Geometry, Student Edition
Additional Math Textbook Solutions
Fundamentals of Statistics (5th Edition)
Essentials of Statistics, Books a la Carte Edition (5th Edition)
Finite Mathematics & Its Applications (12th Edition)
Probability and Statistics for Engineers and Scientists
University Calculus: Early Transcendentals (3rd Edition)
Using and Understanding Mathematics: A Quantitative Reasoning Approach (6th Edition)


 Elementary Geometry For College Students, 7eGeometryISBN:9781337614085Author:Alexander, Daniel C.; Koeberlein, Geralyn M.Publisher:Cengage,
 Elementary Geometry for College StudentsGeometryISBN:9781285195698Author:Daniel C. Alexander, Geralyn M. KoeberleinPublisher:Cengage Learning