
Principles of Geotechnical Engineering (MindTap Course List)
9th Edition
ISBN: 9781305970939
Author: Braja M. Das, Khaled Sobhan
Publisher: Cengage Learning
expand_more
expand_more
format_list_bulleted
Concept explainers
Videos
Textbook Question
Chapter 4, Problem 4.6P
Refer to the soil in Problem 4.5. Using the Casagrande plasticity chart, graphically estimate the shrinkage limit of the soil as shown in Figure 4.22.
4.5 The following data were obtained by conducting liquid limit and plastic limit tests on a soil collected from the site.
Liquid limit tests:
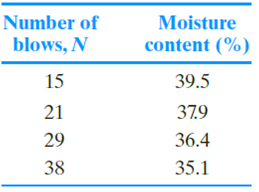
Plastic limit test: PL = 19.3%
a. Draw the flow curve and determine the liquid limit.
b. Using the Casagrande plasticity chart (Figure 4.21), determine the soil type.
Expert Solution & Answer

Trending nowThis is a popular solution!

Students have asked these similar questions
The same soil sample has a natural moisture content of 30% and was subject to the
Atterberg Limits test. The plastic limit was measured as 27 while the liquid limit test shows
the results in the table below.
Number of Blows
42
26
10
Moisture Content
20
32
45
a. Determine the liquid limit of the soil sample. Show and briefly explain how you got the
answer.
b. Solve and describe the Plasticity Index of the soil sample.
c. Determine value and soil state of the liquidity index of the soil sample.
d. Determined and describe the clay activity of the soil sample.
Following are the results from the liquid and plastic limit tests for a soil.
Liquid limit test:
let the N1 be 20 and w1 be 30%
let N2 be 30 and w2 be 20%
let N3 be 40 and w3 be 10%
For Plastic limit test:
let w1 be 12 and let w2 be 13 and let w3 be 13.5
The liquid limit =
Plastic limit =
Plasticity Index =
Problem Set 4
4. The following data were obtained from the liquid and plastic limit tests for a soil:
Liquid Limit Test:
Number of blows (N)
Molsture content (%)
a) Draw the flow curve from the
liquid limit test data and find
the liquid limit. (use excel to
graph)
b) What is the plasticity index of
17
42.1
22
38.2
27
36.2
32
34.1
Plastic Limit Test: Moisture content = 21.3%
the soil?
Chapter 4 Solutions
Principles of Geotechnical Engineering (MindTap Course List)
Ch. 4 - During Atterberg limit tests in the soil mechanics...Ch. 4 - Prob. 4.2PCh. 4 - Prob. 4.3PCh. 4 - Results from a liquid limit test conducted on a...Ch. 4 - The following data were obtained by conducting...Ch. 4 - Refer to the soil in Problem 4.5. Using the...Ch. 4 - Following results are obtained for a liquid limit...Ch. 4 - Prob. 4.8PCh. 4 - Prob. 4.9PCh. 4 - Prob. 4.10P
Knowledge Booster


Learn more about
Need a deep-dive on the concept behind this application? Look no further. Learn more about this topic, civil-engineering and related others by exploring similar questions and additional content below.Similar questions
- Question 8 (1) - Oedometer test What are the boundary conditions applied to a soil sample tested in an Oedometer? Z H a) Pore water pressure at z = H (top of the sample) is PH = Yw. H b) Ez = Ex c) &z=&v (₂ is the volumetric strain of the sample) d) At time t=0, 4p = 0arrow_forward2a. The following data was obtained from Liquid Limit Test conducted at a Soil Lab. Using the data given in Table 01, determine the following; Liquid Limit Determination Specimen No. No. of Blows Wt. of Container Wt. of Container + Wet Soil Wt. of Container + Dry Soil i. ii. Unit 1 14 (g) 7.17 (g) 27.97 (9) 21.37 2 20 7.37 27.37 21.27 3 28 7.77 28.47 22.37 4 32 10.97 30.17 24.67 I Determine the Liquid Limit and Flow Index If Plastic Limit of this soil is 22. Classify the soil based on BS Soil Classification system. 5 39 7.27 26.57 21.17arrow_forwardU B. ( A Soil Specimen has the following characteristics: % passing No.4 sieve = 85 % passing No.200 sieve = 11 D60 = 2 mm D30 = 0.35 mm D₁0 = 70 μm L.L = 36% P.L = 31% D8 = 2 µm 1. Classify the specimen according to the Unified Soil Classification System (USCS). Assign the group name and the group symbol. 2. Determine the soil activity. 3. Determine the soil Liquidity index and consistency index if we = 26%.arrow_forward
- During Atterberg limit tests in the soil mechanics laboratory, the students obtained the following results from a clayey soil. Liquid limit test: Number of blows, N Mosture content (%) 12 35.2 19 29.5 27 25.4 37 21 Draw the flow curve and obtain the liquid limit. • If plasticity index of the soil is 6.5 what is the plastic limit of this soil? • Determine the flow index. • Determine the liquidity index of the soil if the in-situ moisture content is 23.8%, and comment on the probable engineering behavior of this soil.arrow_forwardA hydrometer test was conducted on the material passing sieve No, 200 and the results are listed in the table below, The results of sieve analysis on the soil showed that the percentage passing No. 4 was 90 % and that passing No. 200 was 20 %. Estimate the clay size fraction in the soil. Table : Results of hydrometer test diameter (mm) 0.0700 0.0400 0.0150 0.0020 % finer (combined) 19 finer 95 80 16 65 13 45 0.0010 30 6 Select one:arrow_forwardA sample of soil was tested in the laboratory, and the test results were listed as follows. Classify the soil by Unified Soil Classification System. 1. Liquid limit = 29%. 2. Plastic limit = 19%. 3. Mechanical grain-size analysis:arrow_forward
- Homework 1-Results from liquid and plastic limit tests conducted on a soil are Moisture given below. Plastic limit tests: PL 13.4% a) Draw the flow curve and obtain the liquid limit. b) What is the plasticity index of the soil? C) Determine the liquidity index of the soil if Win situ = 32% Number of blows, N content (%) 39.2 %3D 15 34.5 22 26 31.2 29.0 %3D 29 U.S. sieve no. Mass of soil retained 1- The followiarrow_forwardH.W The detailed results of a standard Proctor test on a soil classified as CL-ML and group name silty clay with sand are shown in the table below. Determine the maximum dry unit weight and optimum water content. Diameter of mould = 4 in. Height of mould = 4.584 in. Volume of mould = 1/30 ft3. Weight of mould. M = 4.45 lb. Unit weight data Water content data Weight of wet soil and mold (Ibs) Mass of can and dry soil (grams) Mass of can and Mass of can wet soil (grams) (grams) M. M. м. 7.32 114.92 111.48 155.08 46.50 7.57 163.12 46.43 7.68 190.43 178.64 46.20 46.50 7.74 193.13 178.24 7.65 188.77 171.58 46.10arrow_forwardPermeability tests were performed on a soil sample, under different void ratio and different temperatures and the following results were obtained. Test No. 1 2 Void ratio (e) 0.65 1.02 Temperature °℃ 25° 40⁰ Estimate the coefficient of permeability at a temperature of 20°C for a voids ratio of 0.80. Given the following physical properties of water: At 20°C, n = 10.09 × 10+ and p„ = 0.998 g/cm³ At 25°C, n = 8.95 × 10⁴ g sec/cm² and p k(cm/s) 0.4x10 1.9x10-¹ At 40° C, n = 6.54 × 10-¹ g sec/cm² and p $0.997 g/cm³ = = 0.992 g/cm³arrow_forward
- The following data were obtained by conducting liquid limit and plastic limit tests on a soil collected from the site. Liquid limit tests: Number of blows, N 15 21 29 38 Moisture content (%) 39.5 37.9 36.4 35.1 Plastic limit test: PL = 19.3% a. Draw the flow curve and determine the liquid limit. b. Using the Casagrande plasticity chart (Figure 4.21), determine the soil type.arrow_forwardDuring Atterberg limit tests in the soil mechanics laboratory, the students obtained the following results from a clayey soil. Number of Blows (N) Moisture Content (%) 14 38.4 16 36.5 20 33.1 28 27.0 Plastic limit tests: Students conducted two trials and found that PL = 17.2% for the first trial and PL = 18.4% for the second trial. Assume that the liquid limit of the soil is . LL = 29.0% a. Determine the flow index. b. Determine the liquidity index of the soil if the in situ moisture content is 22.0%.arrow_forward22. For a soil specimen, the following are given: % passing Sieve No. 4 = 92% % passing Sieve No. 10 = 81% % passing Sieve No. 40 = 78% % passing Sieve No. 200 = 65% LL = 48% PI = 32% a. Classify the soil by the AASHTO system. b. Classify the soil by the USCS.arrow_forward
arrow_back_ios
SEE MORE QUESTIONS
arrow_forward_ios
Recommended textbooks for you
 Principles of Geotechnical Engineering (MindTap C...Civil EngineeringISBN:9781305970939Author:Braja M. Das, Khaled SobhanPublisher:Cengage Learning
 Fundamentals of Geotechnical Engineering (MindTap...Civil EngineeringISBN:9781305635180Author:Braja M. Das, Nagaratnam SivakuganPublisher:Cengage Learning
 Principles of Foundation Engineering (MindTap Cou...Civil EngineeringISBN:9781337705028Author:Braja M. Das, Nagaratnam SivakuganPublisher:Cengage Learning
Principles of Geotechnical Engineering (MindTap C...
Civil Engineering
ISBN:9781305970939
Author:Braja M. Das, Khaled Sobhan
Publisher:Cengage Learning
Fundamentals of Geotechnical Engineering (MindTap...
Civil Engineering
ISBN:9781305635180
Author:Braja M. Das, Nagaratnam Sivakugan
Publisher:Cengage Learning
Principles of Foundation Engineering (MindTap Cou...
Civil Engineering
ISBN:9781337705028
Author:Braja M. Das, Nagaratnam Sivakugan
Publisher:Cengage Learning
How Are Highways Designed?; Author: Practical Engineering;https://www.youtube.com/watch?v=9XIjqdk69O4;License: Standard Youtube License