Videos
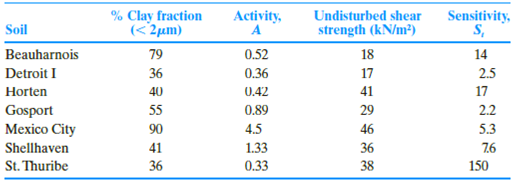
The properties of seven different clayey soils are shown below (Skempton and Northey, 1952). Investigate the relationship between the strength and plasticity characteristics by performing the following tasks:
a. Estimate the plasticity index for each soil using Skempton’s definition of activity [Eq. (4.28)].
b. Estimate the probable mineral composition of the clay soils based on PI and A (use Table 4.3)
c. Sensitivity (St) refers to the loss of strength when the soil is remolded or disturbed. It is defined as the ratio of the undisturbed strength (τf-undisturbed) to the remolded strength (τf-remolded)) at the same moisture content [Eq. (12.49)]. From the given data, estimate τf-remolded for the clay soils.
d. Plot the variations of undisturbed and remolded shear strengths with the activity, A, and explain the observed behavior.
(a)
Find the plasticity index for each soil using Skempton’s definition of activity.
Explanation of Solution
Determine the plasticity index of the Beauharnais soil using the relation.
Here, A is an activity.
Substitute 0.52 for A and 79 for % of clay–size fraction, by weight.
Similarly, calculate the plasticity index for the remaining soils.
Determine the remolded shear strength of the Beauharnais soil using the relation.
Here,
Substitute
Similarly, calculate the remolded shear strength of the remaining soils.
Summarize the calculated values of plasticity index and the remolded shear strength as in Table 1.
| Soil | % Clay fraction | Activity A | Plasticity Index |
| Beauharnois | 79 | 0.52 | 41.08 |
| Detroit I | 36 | 0.36 | 12.96 |
| Horten | 40 | 0.42 | 16.80 |
| Gosport | 55 | 0.89 | 48.95 |
| Mexico City | 90 | 4.5 | 405 |
| Shell haven | 41 | 1.33 | 54.53 |
| St.Thuribe | 36 | 0.33 | 11.88 |
(b)
Find the probable mineral composition of the clay soils based on PI and A.
Explanation of Solution
Determine the probable mineral composition of the clay soils based on PI and A.
Refer Table 4.3, “Typical values of liquid limit, plastic limit, and activity of some clay minerals” in the textbook.
Take the mineral composition of the Beauharnois soil as Illite for the activity value of 0.52 and the plasticity index value of 41.08.
Therefore, the mineral composition of Beauharnois soil is Illite.
Similarly, calculate the probable mineral composition of the remaining soils.
Summarize the calculated values of mineral composition as in Table (2).
| Soil | Activity A | Plasticity Index | Mineral composition |
| Beauharnois | 0.52 | 41.08 | Illite |
| Detroit I | 0.36 | 12.96 | Kaolinite |
| Horten | 0.42 | 16.80 | Kaolinite |
| Gosport | 0.89 | 48.95 | Illite |
| Mexico City | 4.5 | 405 | Montmorillonite |
| Shell haven | 1.33 | 54.53 | Montmorillonite |
| St.Thuribe | 0.33 | 11.88 | Kaolinite |
(c)
Find the remoulded shear strength of the clay soil.
Explanation of Solution
Determine the remoulded shear strength of the Beauharnais soil using the relation.
Here,
Substitute
Similarly, calculate the remolded shear strength of the remaining soils.
Summarize the calculated values of remolded shear strength as in Table 3.
| Soil | Activity A | Undisturbed Shear strength | Sensitivity |
Remoulded Shear strength |
| Beauharnois | 0.52 | 18 | 14 | 1.3 |
| Detroit I | 0.36 | 17 | 2.5 | 6.8 |
| Horten | 0.42 | 41 | 17 | 2.4 |
| Gosport | 0.89 | 29 | 2.2 | 13.2 |
| Mexico City | 4.5 | 46 | 5.3 | 8.7 |
| Shell haven | 1.33 | 36 | 7.6 | 4.7 |
| St.Thuribe | 0.33 | 38 | 150 | 0.3 |
(d)
Plot the variations of undisturbed and remolded shear strengths with the activity A.
Explanation of Solution
Refer Table 3.
Plot the graph between the undisturbed, remolded shear strengths with the activity A as in Figure 1.
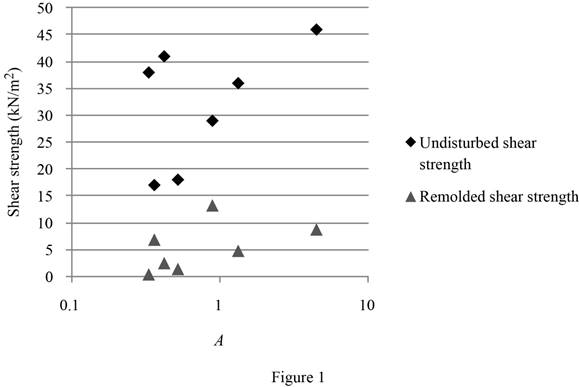
The shear strength of the clay obtains from two components, one is cohesion, which is the cementing force between particles, and second one is frictional resistance, which is mainly due to the particle movement of one particle over another. The cohesion contribution is greater to the shear strength, when the clay activity is greater. Although no reliable correlation can be developed from Figure 1, both the undisturbed and remolded shear strengths certainly show increasing trends as the activity increases.
Want to see more full solutions like this?
Chapter 4 Solutions
Principles of Geotechnical Engineering (MindTap Course List)


- project management questionarrow_forwardproject management question Q5/Barrow_forwardProblem 1: Given: In a given floor system, a 5-in concrete slab supported by T-beams of 24-ft spans, supporting 354 psf live load. The T-beams are spaced 2x4 ft on center, and bw (width of the beam web) = 15 inches. Total T-beam height is 25 inches. f'c = 4,000psi, fy = 60,000psi. Design the T-beam. Show all steps. Sketch your Design. Problem 2: Given: A 25"x25" column is subject to a factored axial load of Pu=1,200 kips, and factored design moment of Mu-354 kips-ft. f'c 4,000psi, fy = 60,000psi. Determine the required steel ratio (p) and ties. Sketch the design. 2.0 0.08 INTERACTION DIAGRAM R4-60.9 fc-4 ksi 1.8 1,- 60 ksi 0.07 Y=0.9 16 1.6 0.06 Kmax 0.05 1.4 f/f, = 0 0.04 00 K₁ = P₁/f'c Ag 1.2 12 0.03 0.25 1.0 10 0.02 0.01 0.8 0.6 0.4 €,= 0.0035 0.2 €,= 0.0050 0.0 h yh 0.50 0.75 1.0. 0.00 0.05 0.10 0.15 0.20 0.25 0.30 0.35 0.40 0.45 0.50 R₁ = P₁e/f'Agharrow_forward
- Given: In a given floor system, a 5-in concrete slab supported by T-beams of 24-ft spans, supporting 354 psf live load. The T-beams are spaced 2x4 ft on center, and bw (width of the beam web) = 15 inches. Total T-beam height is 25 inches. f'c = 4,000psi, fy = 60,000psi. Design the T-beam. Show all steps. Sketch your Design.arrow_forwardProblem 2: Given: A 25"x25" column is subject to a factored axial load of Pu=1,200 kips, and factored design moment of Mu-354 kips-ft. f'c 4,000psi, fy = 60,000psi. Determine the required steel ratio (p) and ties. Sketch the design. 2.0 P=0.08 INTERACTION DIAGRAM R4-60.9 fc-4 ksi 1.8 1,- 60 ksi 0.07 7=0.9 1.6 16 0.06 Kmax 0.05 1.4 f/f, = 0 0.04 90 K₁ = P₁/f'Ag 1.2 0.03 0.25 0.02 1.0 0.01 0.8 0.6 0.4 €= 0.0035 0.2 €,= 0.0050 0.0 h yh 0.50 0.75 1.0. 0.00 0.05 0.10 0.15 0.20 0.25 0.30 0.35 0.40 0.45 0.50 R₁ = P₁e/f'Aharrow_forwardGiven: A 25"x25" column is subject to a factored axial load of Pu=1,200 kips, and factored design moment of Mu=354 kips-ft. f'c 4,000psi, fy = 60,000psi. Determine the required steel ratio () and ties. Sketch the design.arrow_forward
- See Figure (1) below. A 14 in. wide and 2 in. thick plate subject to tensile loading has staggered holes as shown. Compute An and Ae. P 2.00 3.00 4.00 3.00 2.00 ΕΙ T A B C F G D S = 2.50 3/4" bolts in 13/16" holes 14x12 PL Parrow_forwardNo ai answers okk only human experts solve it correct complete solutions okk only Civil Engineering experts solve it okkkarrow_forwardNo ai answers okk only human experts solve it correct complete solutions okk only Civil Engineering experts solve it okkk....arrow_forward
 Principles of Geotechnical Engineering (MindTap C...Civil EngineeringISBN:9781305970939Author:Braja M. Das, Khaled SobhanPublisher:Cengage Learning
 Principles of Foundation Engineering (MindTap Cou...Civil EngineeringISBN:9781337705028Author:Braja M. Das, Nagaratnam SivakuganPublisher:Cengage Learning