
Mylab Operations Management With Pearson Etext -- Access Card -- For Operations Management: Sustainability And Supply Chain Management (13th Edition)
13th Edition
ISBN: 9780135225899
Author: Jay Heizer, Barry Render, Chuck Munson
Publisher: PEARSON
expand_more
expand_more
format_list_bulleted
Concept explainers
Videos
Textbook Question
Chapter 4, Problem 30P
Dr. Lillian Fok, a New Orleans psychologist, specializes in treating patients who are agoraphobic (i.e., afraid to leave their homes). The following table indicates how many patients Dr. Fok has seen each year for the past 10 years. It also indicates what the robbery rate was in New Orleans during the same year:
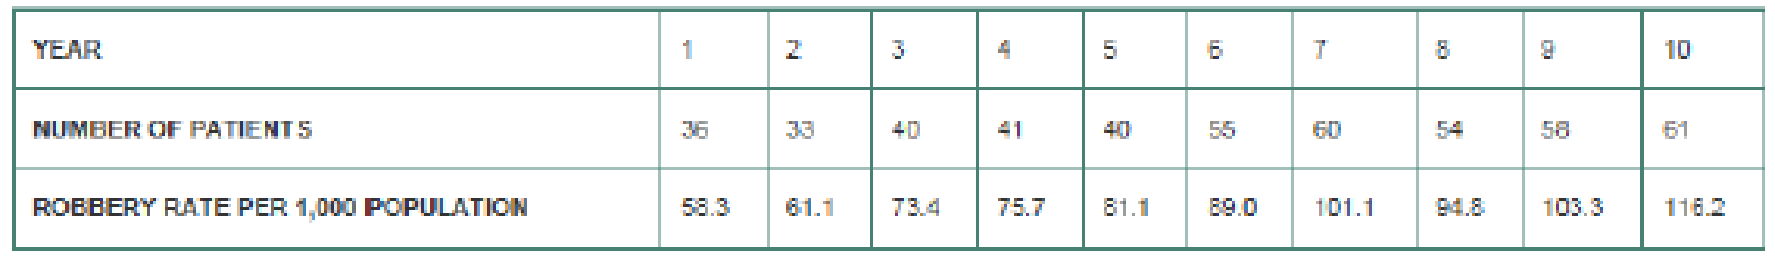
Using trend (linear regression) analysis, predict the number of patients Dr. Fok will see in years 11 and 12 as a function of time. How well does the model fit the data?
Expert Solution & Answer
Want to see the full answer?
Check out a sample textbook solution
Students have asked these similar questions
Dr. Lillian Fok, a New Orleans psychologist, spe-cializes in treating patients who are agoraphobic (i.e., afraid
to leave their homes). The following table indicates how manypatients Dr. Fok has seen each year for the past 10 years. It alsoindicates what the robbery rate was in New Orleans during thesame year:
Using trend (linear regression) analysis, predict the number ofpatients Dr. Fok will see in years 11 and 12 as a function of time.How well does the model fit the data?
Dr. Lillian Fok, a New Orleans psychologist, specializes in treating patients who are agoraphobic (e, afraid to leave their homes). The following table indicates how many patients Dr. Fokhas seen
each year for the past 10 years. It also indicates what the robbery rate was in New Orleans during the same year
Year
Number of Patients
Robbery Rate per
1,000 Population
The simple linear regression equation that shows the best relationship between the number of patients and year is (round your responses to three decimal places
where y Dependent Variable and x= Independent Variable
1
2
37 32
58.0 60.6
3
39
73.0
4
41
75.2
5
6
40 56
78.5 89.5
7
58
8
53
57
101.1 94.2 102.2
9
10
61
117.2
save
Dr. Lillian Fok, a New Orleans psychologist, specializes in treating patients who are agoraphobic (i.e., afraid to leave their homes). The following table indicates how many patients Dr. Fok has seen
each year for the past 10 years. It also indicates what the robbery rate was in New Orleans during the same year.
Year
Number of Patients
Robbery Rate per
1,000 Population
The simple linear regression equation that shows the best relationship between the number of patients and year is (round your responses to three decimal places):
where y Dependent Variable and x = Independent Variable.
1
37
57.8
2
33
61.4
3
39
73.0
4
6
54
41
75.7 81.1 88.6
5
41
7
58
101.1
8
54
94.2
9
57
104.1
0
10
61
116.2
Chapter 4 Solutions
Mylab Operations Management With Pearson Etext -- Access Card -- For Operations Management: Sustainability And Supply Chain Management (13th Edition)
Ch. 4 - Prob. 1EDCh. 4 - What is a qualitative foretasting model, and when...Ch. 4 - Identify and briefly describe the two general...Ch. 4 - Identify the three forecasting time horizons....Ch. 4 - Briefly describe the steps that are used to...Ch. 4 - A skeptical manager asks what medium-range...Ch. 4 - Explain why such forecasting devices as moving...Ch. 4 - What is the basic difference between a weighted...Ch. 4 - What three methods are used to determine the...Ch. 4 - Research and briefly describe the Delphi...
Ch. 4 - What is the primary difference between a...Ch. 4 - Define time series.Ch. 4 - What effect does the value of the smoothing...Ch. 4 - Explain the value of seasonal indices in...Ch. 4 - Which forecasting technique can place the most...Ch. 4 - In your own words, explain adaptive forecasting.Ch. 4 - What is the purpose of a tracking signal?Ch. 4 - Explain, in your own words, the meaning of the...Ch. 4 - What is the difference between a dependent and an...Ch. 4 - Give examples of industries that are affected by...Ch. 4 - Give examples of industries in which demand...Ch. 4 - Prob. 21DQCh. 4 - The following gives the number of pints of type B...Ch. 4 - 4.2 a. Plot the above data on a graph. Do you...Ch. 4 - Refer to Problem 4.2. Develop a forecast for years...Ch. 4 - A check-processing center uses exponential...Ch. 4 - The Carbondale Hospital is considering the...Ch. 4 - The monthly sales for Yazici Batteries, Inc., were...Ch. 4 - The actual demand for the patients at Omaha...Ch. 4 - Daily high temperatures in St. Louis for the last...Ch. 4 - Lenovo uses the ZX-81 chip in some of its laptop...Ch. 4 - Data collected on the yearly registrations for a...Ch. 4 - Use exponential smoothing with a smoothing...Ch. 4 - Consider the following actual and forecast demand...Ch. 4 - As you can see in the following table, demand for...Ch. 4 - Following are two weekly forecasts made by two...Ch. 4 - Refer to Solved Problem 4.1 on page 138. a. Use a...Ch. 4 - Solved example 4.1 Sales of Volkswagens popular...Ch. 4 - Refer to Solved Problem 4.1. Using smoothing...Ch. 4 - Consider the following actual (At) and forecast...Ch. 4 - Income at the architectural firm Spraggins and...Ch. 4 - Question 4.20 Resolve Problem 4.19 with =.1 and ...Ch. 4 - Question 4.21 Refer to the trend-adjusted...Ch. 4 - Question 4.22 Refer to Problem 4.21. Complete the...Ch. 4 - Question 4.23 Sales of quilt covers at Bud Baniss...Ch. 4 - Question 4.24 Mark Gershon, owner of a musical...Ch. 4 - Question 4.25 The following gives the number of...Ch. 4 - Prob. 25PCh. 4 - Question 4.27 George Kyparisis owns a company...Ch. 4 - Question 4.28 Attendance at Orlandos newest...Ch. 4 - Question 4.29 North Dakota Electric Company...Ch. 4 - Lori Cook has developed the following forecasting...Ch. 4 - Prob. 45PCh. 4 - Question 4.32 The following data relate the sales...Ch. 4 - Question 4.33 The number of internal disk drives...Ch. 4 - Question 4.34 The number of auto accidents in...Ch. 4 - Question 4.35 Rhonda Clark, a Slippery Rock,...Ch. 4 - Accountants at the Tucson firm, Larry Youdelman,...Ch. 4 - Sales of tablet computers at Ted Glickmans...Ch. 4 - Question 4.38 City government has collected the...Ch. 4 - Dr. Lillian Fok, a New Orleans psychologist,...Ch. 4 - Using the data in Problem 4.39, apply linear...Ch. 4 - Bus and subway ridership for the summer months in...Ch. 4 - Emergency calls to the 911 system of Durham, North...Ch. 4 - Using the 911 call data in Problem 4.43, forecast...Ch. 4 - The following are monthly actual and forecast...Ch. 4 - Thirteen students entered the business program at...Ch. 4 - Question 4.47 Storrs Cycles has just started...Ch. 4 - Question 4.48 Dave Fletcher, the general manager...Ch. 4 - Prob. 35PCh. 4 - Prob. 36PCh. 4 - Prob. 37PCh. 4 - Prob. 38PCh. 4 - Prob. 39PCh. 4 - Prob. 40PCh. 4 - Prob. 41PCh. 4 - Prob. 42PCh. 4 - Prob. 55PCh. 4 - Prob. 56PCh. 4 - Prob. 57PCh. 4 - Prob. 58PCh. 4 - Prob. 61PCh. 4 - Case study Southwestern University: (B) This...Ch. 4 - Case study Southwestern University: (B) This...Ch. 4 - Southwestern University: (B) This integrated case...Ch. 4 - For its first 2 decades of existence, the NBAs...Ch. 4 - For its first 2 decades of existence, the NBAs...Ch. 4 - For its first 2 decades of existence, the NBAs...Ch. 4 - For its first 2 decades of existence, the NBAs...Ch. 4 - Forecasting at Hard Rock Cafe Video Case With the...Ch. 4 - Forecasting at Hard Rock Cafe Video Case With the...Ch. 4 - Forecasting at Hard Rock Cafe Video Case With the...Ch. 4 - Forecasting at Hard Rock Cafe Video Case With the...Ch. 4 - Forecasting at Hard Rock Cafe Video Case With the...
Knowledge Booster


Learn more about
Need a deep-dive on the concept behind this application? Look no further. Learn more about this topic, operations-management and related others by exploring similar questions and additional content below.Similar questions
- 10 Dr. Lillian Fok, a New Orleans psychologist, specializes in treating patients who are agoraphobic (i.e., afraid to leave their homes). The following table indicates how many patients Dr. Fokh each year for the past 10 years. It also indicates what the robbery rate was in New Orleans during the same year: ! 1 F1 A 1 option Year Number of Patients Robbery Rate per 1,000 Population The simple linear regression equation that shows the best relationship between the number of patients and the robbery rate is (round your responses to three decimal places): ŷ=0+0x N @ 2 W S X command A where y Number of Patients and x = Robbery Rate. In year 11, if the robbery rate increases to 133.40, using trend analysis, the number of patients Dr. Fok will see = patients (round your response to two decimal places). In year 11, if the robbery rate decreases to 90.6, using trend analysis, the number of patients Dr. Fok will see = patients (round your response to two decimal places). #3 80 F3 E D $ 4 C 888…arrow_forwardExplain the Simple Linear Regression?arrow_forwardThe following gives the number of accidents that occurred on Florida State Highway 101 during the last 4 months: Month Jan Feb Mar Apr Number of Accidents 25 45 60 105 Using the least-squares regression method, the trend equation for forecasting is (round your responses to two decimal places): y = - 5 + 25.5 x Using least-squares regression, the forecast for the number of accidents that will occur in the month of May = 122.5 accidents (enter your response as a whole number).arrow_forward
- The Tech power plant burns coal and natural gas to generate steam and electricity for all campus buildings. The annual coal consumption at the plant has increased annually for the past 6 years due to an aggressive campus building program. The following table shows the annual coal consumption: Year Coal Consumption (tons) 1 25000 2 23000 3 28000 4 35000 5 37000 6 42000 Develop a linear trend model to forecast coal consumption for the 7 th year. Don't answer by pen paper and don't use chatgpt otherwise we will give dounvotearrow_forwardThe following gives the number of accidents that occurred on Florida State Highway 101 during the last 4 months: Month Number of Accidents Jan 25 Feb 40 Mar 70 Apr 90 Using the least-squares regression method, the trend equation for forecasting is (round your responses to two decimal places): ŷ=+xarrow_forwardThe following gives the number of accidents that occurred on Florida State Highway 101 during the last 4 months: Month Number of Accidents Jan 30 Using least-squares regression, the forecast for the number of accidents that will occur in the month of May Feb 48 Using the least-squares regression method, the trend equation for forecasting is (round your responses to two decimal places): y = 9 + 19.20 x = Mar 60 Apr 90 accidents (enter your response as a whole number).arrow_forward
- What are some of the common Business Statistics used in Excell for Hospitality Management?arrow_forward12.7 The Intrepid mutual fund of growth stocks has had the following average monthly price for the past 10 months. Month 1 2 3 4 5 6 7 8 9 10 Fund Price 62.7 63.9 68.0 66.4 67.2 65.8 68.2 69.3 67.2 70.1 Compute the exponentially smoothed forecast with a = 0.40, the adjusted exponentially smoothed forecast with a = 0.40 and ß = 0.30, and the linear trend line forecast. Compare the accuracy of the three forecasts using cumulative error and MAD, and indicate which forecast appears to be most accurate.arrow_forwardDaily high temperatures in St. Louis for the last week were as follows: 92, 94, 95, 92, 95, 86, 95 (yesterday). degrees (round your response to one decimal a) The high temperature for today using a 3-day moving average = [ place). b) The high temperature for today using a 2-day moving average = place). degrees (round your response to one decimal c) The mean absolute deviation based on a 2-day moving average = degrees (round your response to one decimal place). d) The mean squared error for the 2-day moving average = degrees2 (round your response to one decimal place). e) The mean absolute percent error (MAPE) for the 2-day moving average=% (round your response to one decimal place). iev Sarrow_forward
- Alvin Cheah is a marketing analyst for Rockstar Travel Company. He wants to analyze the trend of international tourist arrival in Tawau by using international tourist arrival rate and flight delayed rate over the past 10 years as given in Table 2 below: (Hint: Provides your answers in two decimal points) Table 2 Year 2010 2011 2012 2013 2014 2015 2016 2017 2018 2019 Arrival 35.5 28.0 30.3 36.0 49.5 56.0 72.4 71.0 79.3 96.0 C000) Delayed 4.2 3.8 3.8 3.5 4.6 4.5 4.6 4.6 4.7 4.5 rate (1) Propose ONE (1) forecasting model that can be used by Alvin. Why would you proposed that particular model? (5 marks) (ii) Develop the forecasting model that you suggest in (i). Briefly explain your model. (20 marks)arrow_forwardThe consumer loan department at Central Union Bank and Trust wants to develop a forecasting model to help determine its potential loan application volume for the coming year. Because adjustable-rate home mortgages are based on government long-term treasury note rates, the department collected the following data for 3- to 5-year treasury note interest rates for the past 24 years: Develop an appropriate forecast model for the bank to use to forecast treasury note rates in the future and indicate how accurate it appears to be compared to historical data.arrow_forwardHow is exponential smoothing superior to moving averages as a forecasting tool?arrow_forward
arrow_back_ios
SEE MORE QUESTIONS
arrow_forward_ios
Recommended textbooks for you
 Contemporary MarketingMarketingISBN:9780357033777Author:Louis E. Boone, David L. KurtzPublisher:Cengage Learning
Contemporary Marketing
Marketing
ISBN:9780357033777
Author:Louis E. Boone, David L. Kurtz
Publisher:Cengage Learning
Single Exponential Smoothing & Weighted Moving Average Time Series Forecasting; Author: Matt Macarty;https://www.youtube.com/watch?v=IjETktmL4Kg;License: Standard YouTube License, CC-BY
Introduction to Forecasting - with Examples; Author: Dr. Bharatendra Rai;https://www.youtube.com/watch?v=98K7AG32qv8;License: Standard Youtube License