
Essentials Of Business Analytics
1st Edition
ISBN: 9781285187273
Author: Camm, Jeff.
Publisher: Cengage Learning,
expand_more
expand_more
format_list_bulleted
Concept explainers
Videos
Textbook Question
Chapter 3, Problem 5P
Entrepreneur magazine ranks franchises. Among the factors that the magazine uses in its rankings are growth rate, number of locations, start-up costs, and financial stability. A recent ranking listed the top 20 U.S. franchises and the number of locations as follows:
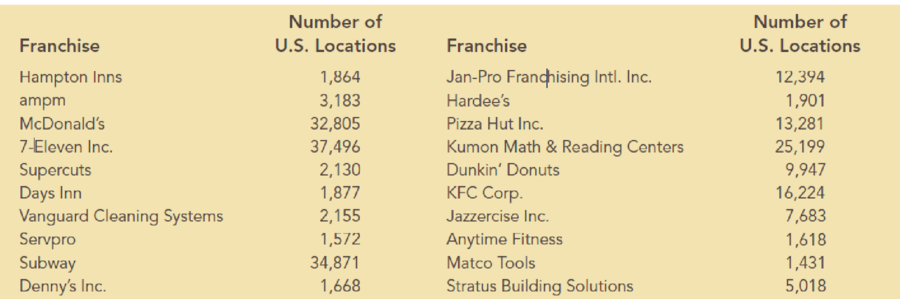
These data can be found in the file Franchises. Create a PivotTable to summarize these data using classes 0–9,999, 10,000–19,999, 20,000–29,999, 30,000–39,999 to answer the following questions. (Hint: Use Number of U.S. Locations as the COLUMNS, and use Count of Number of U.S. Locations as the VALUES in the PivotTable.)
- a. How many franchises have between 0 and 9,999 locations?
- b. How many franchises have more than 30,000 locations?
Expert Solution & Answer

Trending nowThis is a popular solution!

Students have asked these similar questions
The higher education department of Holmes Institute recorded data on the number of students enrolled in the different study majors for the years 2018 and 2019.
Study major
2018
2019
Statistics
1700
2250
Business law
700
900
Accounting
1300
1450
Economics
750
1000
Finance
1450
1758
Marketing management
1069
1189
Auditing
360
351
Use an appropriate graphical technique or chart to compare the number of enrolment in 2018 and 2019 of the different study major. Display the chart.
Use an appropriate graphical technique or chart to display the percentage value of the number of enrolment of the different study major in 2018 and 2019. Display the chart.
Corvette, Ferrari, and Jaguar produced a variety of classic cars that continue to increase in value. The data showing the rarity rating (1–20) and the high price ($1000s) for 15 classic cars is contained in the Excel Online file below. Construct a spreadsheet to answer the following questions.
A real estate major collected information on some recent local home sales. The first 6 lines of the database appear in the accompanying table. The columns correspond to the house identification number, the community name, the zip code, the
number of acres of the property, the year the house was built, the market value, and the size of the living area (in square feet). Do the data appear to have come from a designed survey or experiment? What concerns might you have about
drawing conclusions from this data set?
E Click the icon to view the data table.
Do the data appear to have come from a designed survey or experiment?
O A. It is not clear if the data were obtained from an experiment. They are certainly not from a survey.
O B. It is not clear if the data were obtained from a survey. They are certainly not from an experiment.
O C. It is not clear if the data were obtained from a survey or an experiment.
O D. The data were certainly not obtained from survey or an experiment.
What…
Chapter 3 Solutions
Essentials Of Business Analytics
Ch. 3 - A sales manager is trying to determine appropriate...Ch. 3 - The following table shows an example of gross...Ch. 3 - The following table provides monthly revenue...Ch. 3 - In the file MajorSalary, data have been collected...Ch. 3 - Entrepreneur magazine ranks franchises. Among the...Ch. 3 - The file MutualFunds contains a data set with...Ch. 3 - The file TaxData contains information from federal...Ch. 3 - The file FDICBankFailures contains data on...Ch. 3 - The following 20 observations are for two...Ch. 3 - The file Fortune500 contains data for profits and...
Ch. 3 - The International Organization of Motor Vehicle...Ch. 3 - Prob. 12PCh. 3 - Prob. 13PCh. 3 - The total number of term life insurance contracts...Ch. 3 - An automotive company is considering the...Ch. 3 - Consider the following survey results regarding...Ch. 3 - The Northwest regional manager of Logan Outdoor...Ch. 3 - The Ajax Company uses a portfolio approach to...Ch. 3 - Heat maps can be very useful for identifying...Ch. 3 - The following table shows monthly revenue for six...Ch. 3 - Prob. 21PCh. 3 - Aurora Radiological Services is a health care...Ch. 3 - The motion picture industry is an extremely...
Knowledge Booster


Learn more about
Need a deep-dive on the concept behind this application? Look no further. Learn more about this topic, statistics and related others by exploring similar questions and additional content below.Similar questions
- In 2010, the U.S. Congress passed the historic health care reform bill that will provide some type of coverage for the 32 million Americans currently without health care insurance. Just how widespread is the lack of medical coverage? The media claim that the segments of the population most at risk for disease and thus needing healthcare are women, children, the elderly and the poor. The following tables were generated from the U.S. Census Bureau, Current Population Survey, Annual Social and Economic Supplement (2011). The tables report the number of uninsured (in thousands) by sex, by age, and by household income. Is being insured or not dependent on gender? Fill in the degrees of freedom and p-value in the output below and draw a clear conclusion indicating which gender is more at risk of not being insured if there is a significant difference.arrow_forwardFranchise Hampton Inns ampm McDonald's 5. Top U.S. Franchises. Entrepreneur magazine ranks franchises. Among the factors that the magazine uses in its rankings are growth rate, number of locations, start-up costs, and financial stability. A recent ranking listed the top 20 U.S. franchises and the number of locations as follows: 7-Eleven Inc. Supercuts Days Inn Vanguard Cleaning Systems Servpro Subway Denny's Inc. DATA file Franchises Number of U.S. Locations 1,864 3,183 32,805 37,496 2,130 1,877 2,155 1,572 34,871 1,668 Franchise Jan-Pro Franchising Intl. Inc. Hardee's Pizza Hut Inc. Kumon Math & Reading Centers Dunkin' Donuts KFC Corp. Jazzercise Inc. Anytime Fitness Matco Tools Stratus Building Solutions Number of U.S. Locations 12,394 1,901 13,281 25,199 9,947 16,224 7,683 1,618 1,431 5,018 These data can be found in the file Franchises. Create a Pivot Table to summarize these data using classes 0-9,999, 10,000-19,999, 20,000-29,999, and 30,000-39,999 to answer the following…arrow_forwardEach year forbes ranks the world’s most valuable brands. A portion of the data for 82 ofthe brands in the 2013 forbes list is shown in Table 2.12 (forbes website, february, 2014).The data set includes the following variables:brand: The name of the brand.Industry: The type of industry associated with the brand, labeled Automotive& Luxury, Consumer Packaged Goods, financial Services, Other, Technology.brand Value ($ billions): A measure of the brand’s value in billions of dollarsdeveloped by forbes based on a variety of financial information about the brand.1-Yr Value Change (%): The percentage change in the value of the brand over theprevious year.brand Revenue ($ billions): The total revenue in billions of dollars for the brand.a. Prepare a crosstabulation of the data on Industry (rows) and brand Value ($ billions).Use classes of 0–10, 10–20, 20–30, 30–40, 40–50, and 50–60 for brand Value($ billions).b. Prepare a frequency distribution for the data on Industry.arrow_forward
- In 2010, the U.S. Congress passed the historic health care reform bill that will provide some type of coverage for the 32 million Americans currently without health care insurance. Just how widespread is the lack of medical coverage? The media claim that the segments of the population most at risk for disease and thus needing healthcare are women, children, the elderly and the poor. The following tables were generated from the U.S. Census Bureau, Current Population Survey, Annual Social and Economic Supplement (2011). Explain using supportive arguments from your analyses. Write a general summary paragraph identifying groups lacking in coverage by gender, age and income and commenting on the headline. Reference the observed numbers and percentages in your summary paragraph to see how the groups trend in identifying potentially more at-risk. Analysises for reference: Is being insured or not dependent on gender? Fill in the degrees of freedom and p-value in the output below and draw…arrow_forwardIn 2010, the U.S. Congress passed the historic health care reform bill that will provide some type of coverage for the 32 million Americans currently without health care insurance. Just how widespread is the lack of medical coverage? The media claim that the segments of the population most at risk for disease and thus needing healthcare are women, children, the elderly and the poor. The following tables were generated from the U.S. Census Bureau, Current Population Survey, Annual Social and Economic Supplement (2011). The tables report the number of uninsured (in thousands) by sex, by age, and by household income Is being insured or not dependent on the age groups identified in the analysis? Fill in the degrees of freedom and p-value in the output below and draw a clear conclusion indicating which age-groups are more at risk of not being insured if there is a significant relationshiparrow_forwardIn 2010, the U.S. Congress passed the historic health care reform bill that will provide some type of coverage for the 32 million Americans currently without health care insurance. Just how widespread is the lack of medical coverage? The media claim that the segments of the population most at risk for disease and thus needing healthcare are women, children, the elderly and the poor. The following tables were generated from the U.S. Census Bureau, Current Population Survey, Annual Social and Economic Supplement (2011). The tables report the number of uninsured (in thousands) by sex, by age, and by household income Is being insured or not dependent on the income groups identified in the analysis? Fill in the degrees of freedom and p-value in the output below and draw a clear conclusion indicating which income-groups are more at risk of not being insured if there is a significant relationship.arrow_forward
- On the basis of a population survey, there were 84.4 million males and 98.2 million females 25 years old or older in a certain country. The educational attainment of the males and females is shown in the accompanying table. Complete parts (a) through (d) below.arrow_forwardOn December 17, 2007 baseball writer John Hickey wrote an article for the Seattle P-I about increases to ticket prices for Seattle Mariners games during the 2008 season. The article included a data set that listed the average ticket price for each MLB team, the league in which the team plays (AL or NL), the number of wins during the 2007 season and the cost per win (in dollars). The data for the 16 National League teams are shown below. team league price wins cost/win Arizona Diamondbacks NL 19.68 90 35.40 Atlanta Braves NL 17.07 84 32.89 Chicago Cubs NL 34.30 85 65.33 Cincinnati Reds NL 17.90 72 40.32 Colorado Rockies NL 14.72 90 26.67 Florida Marlins NL 16.70 71 38.13 Houston Astros NL 26.66 73 59.11 Los Angeles Dodgers NL 20.09 82 34.64 Milwaukee Brewers NL 18.11 83 35.37 N.Y. Mets NL 25.28 88 46.56 Philadelphia Phillies NL 26.73 89 48.69 Pittsburgh Pirates NL 17.08 68 40.67 San Diego Padres NL 20.83 89 38.15 San Francisco Giants NL 24.53 71…arrow_forwardOn December 17, 2007 baseball writer John Hickey wrote an article for the Seattle P-I about increases to ticket prices for Seattle Mariners games during the 2008 season. The article included a data set that listed the average ticket price for each MLB team, the league in which the team plays (AL or NL), the number of wins during the 2007 season and the cost per win (in dollars). The data for the 16 National League teams are shown below. team league price wins cost/win Arizona Diamondbacks NL 19.68 90 35.40 Atlanta Braves NL 17.07 84 32.89 Chicago Cubs NL 34.30 85 65.33 Cincinnati Reds NL 17.90 72 40.32 Colorado Rockies NL 14.72 90 26.67 Florida Marlins NL 16.70 71 38.13 Houston Astros NL 26.66 73 59.11 Los Angeles Dodgers NL 20.09 82 34.64 Milwaukee Brewers NL 18.11 83 35.37 N.Y. Mets NL 25.28 88 46.56 Philadelphia Phillies NL 26.73 89 48.69 Pittsburgh Pirates NL 17.08 68 40.67 San Diego Padres NL 20.83 89 38.15 San Francisco Giants NL 24.53 71…arrow_forward
- If a data set contains three groups that each have ten people in them, how many rows will the “data view” have? 30 3 100 10arrow_forwardIn 2011 home prices and mortgage rates dropped so low that in a number of cities the monthly cost of owning a home was less expensive than renting. The following data show the average asking rent for 10 markets and the monthly mortgage on the median priced home (including taxes and insurance) for 10 cities where the average monthly mortgage payment was less than the average asking rent (The Wall Street Journal, November 26–27, 2011).Click on the datafile logo to reference the data. Enter negative values as negative numbers. a. Develop the estimated regression equation that can be used to predict the monthly mortgage given the average asking rent (to 2 decimals).The regression equation is:Mortgage ($) = + Rent ($)arrow_forwardFortune magazine publishes an annual list of 100 best companies to work for. The data in the “HW7.xlsx” file on Moodle shows a portion of the data for a sample of 20 of the companies that made the top 100 list for 2012. The column labeled Rank shows the rank of the company in the Fortune 100 list. The column labeled Size indicates whether the company is a small (fewer than 2500 employees), midsize (2500-10,000 employees) or large company (above 10,000 employees). The column labeled Salaried ($1000s) shows the shows the average annual salary for salaried employees rounded to the nearest $1000. Finally, the column labeled Hourly ($1000s) shows the average annual salary for hourly employees rounded to the nearest $1000. a) Use these data to develop an estimated regression equation that could be used to predict the average annual salary for salaried employees given the average annual salary for hourly employees. b) Use ? = 0.05 to test for overall significance. If you were conducting…arrow_forward
arrow_back_ios
SEE MORE QUESTIONS
arrow_forward_ios
Recommended textbooks for you
 Glencoe Algebra 1, Student Edition, 9780079039897...AlgebraISBN:9780079039897Author:CarterPublisher:McGraw Hill
Glencoe Algebra 1, Student Edition, 9780079039897...
Algebra
ISBN:9780079039897
Author:Carter
Publisher:McGraw Hill
Sampling Methods and Bias with Surveys: Crash Course Statistics #10; Author: CrashCourse;https://www.youtube.com/watch?v=Rf-fIpB4D50;License: Standard YouTube License, CC-BY
Statistics: Sampling Methods; Author: Mathispower4u;https://www.youtube.com/watch?v=s6ApdTvgvOs;License: Standard YouTube License, CC-BY