
Essentials Of Business Analytics
1st Edition
ISBN: 9781285187273
Author: Camm, Jeff.
Publisher: Cengage Learning,
expand_more
expand_more
format_list_bulleted
Concept explainers
Videos
Textbook Question
Chapter 3, Problem 3P
The following table provides monthly revenue values for Tedstar, Inc., a company that sells valves to large industrial firms. The monthly revenue data have been graphed using a line chart in the following figure.

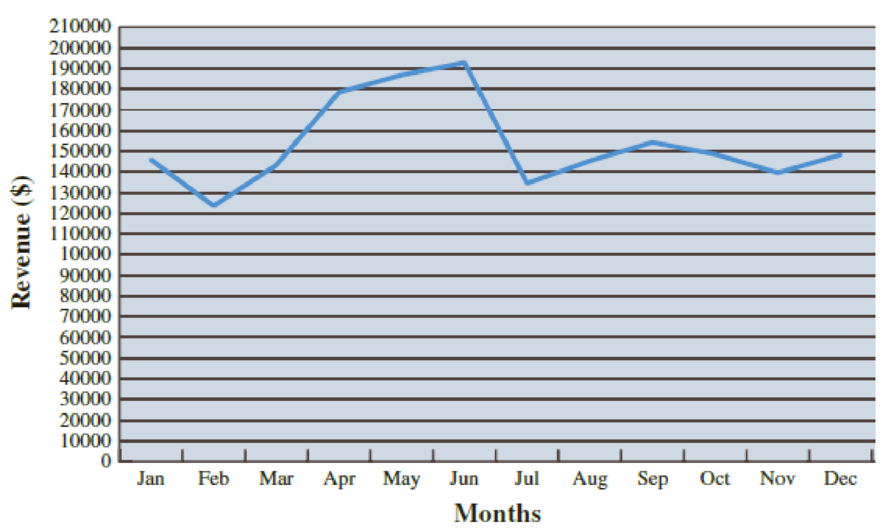
- a. What are the problems with the layout and display of this line chart?
- b. Create a new line chart for the monthly revenue data at Tedstar, Inc. Format the chart to make it easy to read and interpret.
Expert Solution & Answer
Want to see the full answer?
Check out a sample textbook solution
Students have asked these similar questions
The following table provides monthly revenue values for Tedstar, Inc., a company thatsells valves to large industrial firms. The monthly revenue data have been graphed usinga line chart in the following figure.
a. What are the problems with the layout and display of this line chart?b. Create a new line chart for the monthly revenue data at Tedstar, Inc. Format the chartto make it easy to read and interpret.
What would be a suitable chart type to show the proportions of the sales by products?
AS2. NO10. DATA ANALYSIS
Chapter 3 Solutions
Essentials Of Business Analytics
Ch. 3 - A sales manager is trying to determine appropriate...Ch. 3 - The following table shows an example of gross...Ch. 3 - The following table provides monthly revenue...Ch. 3 - In the file MajorSalary, data have been collected...Ch. 3 - Entrepreneur magazine ranks franchises. Among the...Ch. 3 - The file MutualFunds contains a data set with...Ch. 3 - The file TaxData contains information from federal...Ch. 3 - The file FDICBankFailures contains data on...Ch. 3 - The following 20 observations are for two...Ch. 3 - The file Fortune500 contains data for profits and...
Ch. 3 - The International Organization of Motor Vehicle...Ch. 3 - Prob. 12PCh. 3 - Prob. 13PCh. 3 - The total number of term life insurance contracts...Ch. 3 - An automotive company is considering the...Ch. 3 - Consider the following survey results regarding...Ch. 3 - The Northwest regional manager of Logan Outdoor...Ch. 3 - The Ajax Company uses a portfolio approach to...Ch. 3 - Heat maps can be very useful for identifying...Ch. 3 - The following table shows monthly revenue for six...Ch. 3 - Prob. 21PCh. 3 - Aurora Radiological Services is a health care...Ch. 3 - The motion picture industry is an extremely...
Knowledge Booster


Learn more about
Need a deep-dive on the concept behind this application? Look no further. Learn more about this topic, statistics and related others by exploring similar questions and additional content below.Similar questions
- The prices have increased/changed from the last question please read carefullyarrow_forwardAssume this is a partial list of financial highlights from a Best Buy annual report: 2018 2017 (dollars in millions) $ 35,475 1,313 Net sales $ 40,580 Earnings before taxes Net earnings 2, 291 1,378 921 Complete a horizontal and vertical analysis from the above information. (Enter your answers in millions. Round the "percent" answers to the nearest hundredth percent.) Horizontal analysis Vertical analysis 2018 2017 Increase Percent 2018 2017 Net sales $ 40,580 $ 35,475 $ 5,105 % Earnings before taxes 2,291 1,313 978 % % Net earnings 1,378 921 457 % %arrow_forwardComplete the chase production plan, using the following information. The only costs you need to consider here are layoff, hiring, and inventory costs. If you complete the plan correctly, your hiring, layoff, and inventory costs should match those given here. Click the icon to view the costs table. Click the icon to view the forecasted sales. Fill in the production plan table below (enter your responses as whole numbers). More Info Totals Costs Cost of plan Month March Planning values Starting inventory Starting and ending workforce Hours worked per month per worker Hours per unit Hiring cost per worker Layoff cost per worker Monthly per-unit holding cost Print Forecasted sales 1,917 Sales in to meet worker sales hours average = 253 Layoff 256 $256,000 Done Hiring Inventory 256 18,000 $18,000 $1,024,000 $1,298,000 1,500 209 315 35 $4,000 $1,000 $1 Actual workers 209 Actual production Layoffs Hiring More Info Ending inventory 1,500 Month March April May June July August September October…arrow_forward
- JOYFUL Fashion Company is reviewing the monthly sales in year 2021. each month were as below:The monthly sales (in millions) of Jan: $2.2 Feb: $2.5 Mar: $2.0 Apr: $2.8 May: $1.9 Jun: $0.9Jul: $3.4 Aug: $3.7 Sep: $2.1 Oct: $2.5 Nov: $2.3 Dec: $4.6(a) Find the mean, mode, standard deviation, and range of the above data.(b) Comment on the skewness of the above data. Explain your answer with the comparison of quartiles.The JOYFUL Fashion Company will issue a Gold Membership to customers with accumulated spending in January 2022 over 1% of 2021’s average monthly sales and a Platinum Membership to customers with accumulated spending in January 2022 over 1% of the 80th percentile of 2021’s monthly sales.(c) Mrs. Robinson has spent $27,450 in January 2022. Will she be qualified for the Gold Membership? Will she be qualified for the Platinum Membership? Explain your answers.(d) It is known that the average monthly sales from Jul 2020 to Dec 2020 were $1.9 millions. Find the average monthly…arrow_forwardCalculate the net profit margin for a sweater sold for $10 that has a $5 cost of goods sold and 20% operating expenses.arrow_forwardJOYFUL Fashion Company is reviewing the monthly sales in year 2021.The monthly sales (in millions) of each month were as below: Jan: $2.2 Feb: $2.5 Mar: $2.0 Apr: $2.8 May: $1.9 Jun: $0.9 Jul: $3.4 Aug: $3.7 Sep: $2.1 Oct: $2.5 Nov: $2.3 Dec: $4.6| The JOYFUL Fashion Company will issue a Gold Membership to customers with accumulated spending in January 2022 over 1% of 2021's average monthly sales and a Platinum Membership to customers with accumulated spending in January 2022 over 1% of the 80th percentile of 2021's monthly sales. (c) Mrs. Robinson has spent $27,450 in January 2022. Will she be qualified for the Gold Membership? Will she be qualified for the Platinum Membership? Explain your answers. (d) It is known that the average monthly sales from Jul 2020 to Dec 2020 were $1.9 millions. Find the average monthly sales from July 2020 to Dec 2021. (e) Are the JOYFUL Fashion Company sales increasing / decreasing? Explain your answer by comparing the half-yearly average monthly sales.…arrow_forward
arrow_back_ios
arrow_forward_ios
Recommended textbooks for you
 Trigonometry (MindTap Course List)TrigonometryISBN:9781337278461Author:Ron LarsonPublisher:Cengage Learning
 Glencoe Algebra 1, Student Edition, 9780079039897...AlgebraISBN:9780079039897Author:CarterPublisher:McGraw Hill
Trigonometry (MindTap Course List)
Trigonometry
ISBN:9781337278461
Author:Ron Larson
Publisher:Cengage Learning
Glencoe Algebra 1, Student Edition, 9780079039897...
Algebra
ISBN:9780079039897
Author:Carter
Publisher:McGraw Hill
Which is the best chart: Selecting among 14 types of charts Part II; Author: 365 Data Science;https://www.youtube.com/watch?v=qGaIB-bRn-A;License: Standard YouTube License, CC-BY