
Essentials Of Business Analytics
1st Edition
ISBN: 9781285187273
Author: Camm, Jeff.
Publisher: Cengage Learning,
expand_more
expand_more
format_list_bulleted
Concept explainers
Videos
Textbook Question
Chapter 3, Problem 18P
The Ajax Company uses a portfolio approach to manage their research and development (R&D) projects. Ajax wants to keep a mix of projects to balance the expected return and risk profiles of their R&D activities. Consider a situation in which Ajax has six R&D projects as characterized in the table. Each project is given an expected rate of return and a risk assessment, which is a value between 1 and 10, where 1 is the least risky and 10 is the most risky. Ajax would like to visualize their current R&D projects to keep track of the overall risk and return of their R&D portfolio.
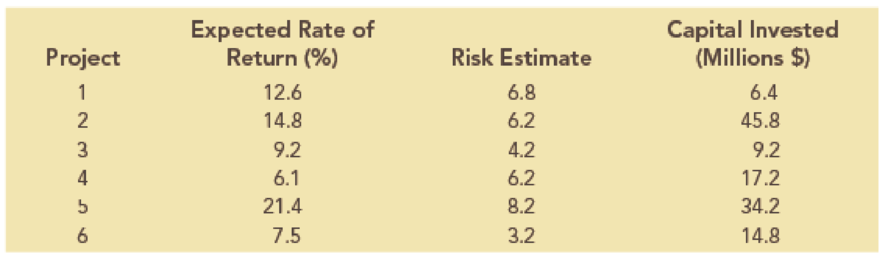
- a. Create a bubble chart in which the expected rate of return is along the horizontal axis, the risk estimate is on the vertical axis, and the size of the bubbles represents the amount of capital invested. Format this chart for best presentation by adding axis labels and labeling each bubble with the project number.
- b. The efficient frontier of R&D projects represents the set of projects that have the highest expected rate of return for a given level of risk. In other words, any project that has a smaller expected rate of return for an equivalent, or higher, risk estimate cannot be on the efficient frontier. From the bubble chart in part a, which projects appear to be located on the efficient frontier?
Expert Solution & Answer

Trending nowThis is a popular solution!

Chapter 3 Solutions
Essentials Of Business Analytics
Ch. 3 - A sales manager is trying to determine appropriate...Ch. 3 - The following table shows an example of gross...Ch. 3 - The following table provides monthly revenue...Ch. 3 - In the file MajorSalary, data have been collected...Ch. 3 - Entrepreneur magazine ranks franchises. Among the...Ch. 3 - The file MutualFunds contains a data set with...Ch. 3 - The file TaxData contains information from federal...Ch. 3 - The file FDICBankFailures contains data on...Ch. 3 - The following 20 observations are for two...Ch. 3 - The file Fortune500 contains data for profits and...
Ch. 3 - The International Organization of Motor Vehicle...Ch. 3 - Prob. 12PCh. 3 - Prob. 13PCh. 3 - The total number of term life insurance contracts...Ch. 3 - An automotive company is considering the...Ch. 3 - Consider the following survey results regarding...Ch. 3 - The Northwest regional manager of Logan Outdoor...Ch. 3 - The Ajax Company uses a portfolio approach to...Ch. 3 - Heat maps can be very useful for identifying...Ch. 3 - The following table shows monthly revenue for six...Ch. 3 - Prob. 21PCh. 3 - Aurora Radiological Services is a health care...Ch. 3 - The motion picture industry is an extremely...
Knowledge Booster


Learn more about
Need a deep-dive on the concept behind this application? Look no further. Learn more about this topic, statistics and related others by exploring similar questions and additional content below.Similar questions
- Find the equation of the regression line for the following data set. x 1 2 3 y 0 3 4arrow_forwardDoes Table 1 represent a linear function? If so, finda linear equation that models the data.arrow_forwardIf you are performing a break-even analysis for a business and their cost and revenue equations are dependent, explain what this means for the company's profit margins.arrow_forward
Recommended textbooks for you

 Functions and Change: A Modeling Approach to Coll...AlgebraISBN:9781337111348Author:Bruce Crauder, Benny Evans, Alan NoellPublisher:Cengage Learning
Functions and Change: A Modeling Approach to Coll...
Algebra
ISBN:9781337111348
Author:Bruce Crauder, Benny Evans, Alan Noell
Publisher:Cengage Learning
Correlation Vs Regression: Difference Between them with definition & Comparison Chart; Author: Key Differences;https://www.youtube.com/watch?v=Ou2QGSJVd0U;License: Standard YouTube License, CC-BY
Correlation and Regression: Concepts with Illustrative examples; Author: LEARN & APPLY : Lean and Six Sigma;https://www.youtube.com/watch?v=xTpHD5WLuoA;License: Standard YouTube License, CC-BY