
Concept explainers
Videos
(a)
To find: The quartic polynomial that best fits the given data.
(a)
Answer to Problem 4P
The quartic polynomial that best fits the given data is equal to
Explanation of Solution
Given information:
Clothing sales tend to vary by season, with more clothes sold in spring and fall. The table gives sales figures for each month at a certain clothing center.
| Month | Sales |
| January | |
| February | |
| March | |
| April | |
| May | |
| June | |
| July | |
| August | |
| September | |
| October | |
| November | |
| December |
Calculation:
Take the sales per thousand i.e.
For the quartic model of data follow the steps below:
First press the
Go to
Now enter the keystrokes
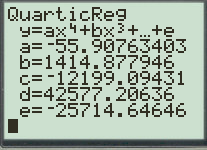
Figure(1)
Therefore, the quartic polynomial that best fits the given data is equal to
(b)
To graph: The
(b)
Explanation of Solution
Given information:
Clothing sales tend to vary by season, with more clothes sold in spring and fall. The table gives sales figures for each month at a certain clothing center.
| Month | Sales |
| January | |
| February | |
| March | |
| April | |
| May | |
| June | |
| July | |
| August | |
| September | |
| October | |
| November | |
| December |
Graph:
To graph the points on scatter plot, follow the steps using graphing calculator.
First press the
Go to
Now press the key
Now, press the
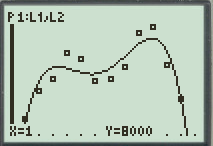
Figure (2)
(c)
To check: Whether the quartic polynomial is a good model for these data.
(c)
Answer to Problem 4P
Yes, the quartic model is good for these set of data as all the points are scattered in the graph of scatter plot and all the points lie near the line of model.
Explanation of Solution
Given information:
Clothing sales tend to vary by season, with more clothes sold in spring and fall. The table gives sales figures for each month at a certain clothing center.
| Month | Sales |
| January | |
| February | |
| March | |
| April | |
| May | |
| June | |
| July | |
| August | |
| September | |
| October | |
| November | |
| December |
Calculation:
As observed from the graph in part(b), the points on the graph of scatter plot are scattered and all the points lies near the graph of the model.
Therefore, the quartic model is good for these set of data as all the points are scattered in the graph of scatter plot and all the points lie near the line of model.
Chapter 3 Solutions
Precalculus: Mathematics for Calculus - 6th Edition


- Let f be a function whose graph consists of 5 line segments and a semicircle as shown in the figure below. Let g(x) = √ƒƒ(t) dt . 0 3 2 -2 2 4 5 6 7 8 9 10 11 12 13 14 15 1. g(0) = 2. g(2) = 3. g(4) = 4. g(6) = 5. g'(3) = 6. g'(13)=arrow_forwardThe expression 3 | (3+1/+1) of the following integrals? A Ов E + + + + 18 3+1+1 3++1 3++1 (A) √2×14 dx x+1 (C) 1½-½√ √ ² ( 14 ) d x (B) √31dx (D) So 3+x -dx is a Riemann sum approximation of which 5 (E) 1½√√3dx 2x+1arrow_forward2. Suppose the population of Wakanda t years after 2000 is given by the equation f(t) = 45000(1.006). If this trend continues, in what year will the population reach 50,000 people? Show all your work, round your answer to two decimal places, and include units. (4 points)arrow_forward
- 3. Solve the equation, give the answer exactly (no calculator approximations), and show all your work. (4 points) log5 2x = 3arrow_forwardLet I = f(x) dx, where f is the function whose graph is shown. 4 2 y f X 1 2 3 4 (a) Use the graph to find L2, R2 and M2. R₂ M2 = = = (b) Are these underestimates or overestimates of I? O 42 is an underestimate. O 42 is an overestimate. ◇ R2 is an underestimate. OR2 is an overestimate. OM2 is an underestimate. ○ M2 is an overestimate. (c) Use the graph to find T2. T₂ =arrow_forwardVector u has a magnitude of 23 and vector v has a magnitude of 83. The angle between the two vectors is 126 degrees.a) Draw a fully-labelled vector diagram showing the two vectors and the resultant vector when they are added together.b) Find the magnitude of the resultant vector.c) Find the direction of the resultant vector relative to vector u. Solding by finding the x and y of the vectors and addingarrow_forward
- 3) If a is a positive number, what is the value of the following double integral? 2a Love Lv 2ay-y² .x2 + y2 dadyarrow_forward16. Solve each of the following equations for x. (a) 42x+1 = 64 (b) 27-3815 (c) 92. 27² = 3-1 (d) log x + log(x - 21) = 2 (e) 3 = 14 (f) 2x+1 = 51-2xarrow_forward11. Find the composition fog and gof for the following functions. 2 (a) f(x) = 2x+5, g(x) = x² 2 (b) f(x) = x²+x, g(x) = √√x 1 (c) f(x) = -1/2) 9 9(x) = х = - Xarrow_forward
 Calculus: Early TranscendentalsCalculusISBN:9781285741550Author:James StewartPublisher:Cengage Learning
 Thomas' Calculus (14th Edition)CalculusISBN:9780134438986Author:Joel R. Hass, Christopher E. Heil, Maurice D. WeirPublisher:PEARSON
 Calculus: Early Transcendentals (3rd Edition)CalculusISBN:9780134763644Author:William L. Briggs, Lyle Cochran, Bernard Gillett, Eric SchulzPublisher:PEARSON
 Calculus: Early TranscendentalsCalculusISBN:9781319050740Author:Jon Rogawski, Colin Adams, Robert FranzosaPublisher:W. H. Freeman
 Calculus: Early Transcendental FunctionsCalculusISBN:9781337552516Author:Ron Larson, Bruce H. EdwardsPublisher:Cengage Learning