
Videos
Radiology
Mobile displays have the potential to increase the flexibility of consulting radiologists if they can be shown to be comparable to traditional display modalities. A study was performed comparing a mobile display iPad 2 with a larger liquid crystal display (LCD) for the diagnosis of tuberculosis (TB) on chest radiography (Abboud et al., [19]). De-identified images of 240 chest X-rays were transferred from a PACS workstation (LCD) to an iPad 2 tablet. The images were reviewed independently by 5 radiologists and were graded as positive or negative for TB on both the LCD and the iPad 2. The reviews occurred at different times to avoid recall bias.
A database of > 500 chest X-rays was created from TB screening films over a 4-month period. Of these, 200 cases originally interpreted as TB-negative and 40 cases originally interpreted as TB-positive were selected at random for study. The images were re-reviewed using both an LCD and an iPad 2 imaging display, albeit at different times. The results were as shown in Table 3.21.
Table 3.21 Comparison of TB screening results using an LCD and iPad 2 display
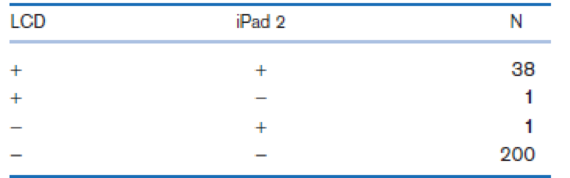
If we regard the LCD interpretation as the gold standard, then what is the specificity of the iPad 2 interpretation?
Want to see the full answer?
Check out a sample textbook solution
Chapter 3 Solutions
Fundamentals of Biostatistics


- Augmented Reality (AR) is a technology that superimposes a computer-generated image on a user's view of the real world, and it is believed that it will soon affect the conventional learning process. A random sample of nine university students was selected to test for the effectiveness of a special course on augmented reality in learning. They were taught how to incorporate AR into their learning process to its full potential. Table 1 gives the scores in a Learning Effectiveness test given to these students before and after attending this course. Question: Test at the 1% significance level whether this AR course makes any statistically significant improvement in the learning effectiveness of all university students.arrow_forwardAugmented Reality (AR) is a technology that superimposes a computer-generated image on a user's view of the real world, and it is believed that it will soon affect the conventional learning process. A random sample of nine university students was selected to test for the effectiveness of a special course on augmented reality in learning. They were taught how to incorporate AR into their learning process to its full potential. Table 1 gives the scores in a Learning Effectiveness test given to these students before and after attending this course. (a) Construct a 95% confidence interval for the mean ?? of the population paired differences.arrow_forwardAugmented Reality (AR) is a technology that superimposes a computer-generated image on a user's view of the real world, and it is believed that it will soon affect the conventional learning process. A random sample of nine university students was selected to test for the effectiveness of a special course on augmented reality in learning. They were taught how to incorporate AR into their learning process to its full potential. Table 1 gives the scores in a Learning Effectiveness test given to these students before and after attending this course. Construct a 95% confidence interval for the mean (mean difference) of the population paired differences.arrow_forward
- An experiment is conducted to see the effect of light intensity on plant growth, what is the dependent variable in this scenario?arrow_forwardYou may need to use the appropriate technology to answer this question. An automobile dealer conducted a test to determine if the time in minutes needed to complete a minor engine tune-up depends on whether a computerized engine analyzer or an electronic analyzer is used. Because tune-up time varies among compact, intermediate, and full-sized cars, the three types of cars were used as blocks in the experiment. The data obtained follow. Analyzer computerized electronic Car compact 50 41 Intermediate 56 45 Full Sized 62 46 Use ? = 0.05 to test for any significant differences. State the null and alternative hypotheses. H0: ?Computerized = ?ElectronicHa: ?Computerized ≠ ?ElectronicH0: ?Computerized ≠ ?ElectronicHa: ?Computerized = ?Electronic H0: ?Computerized = ?Electronic = ?Compact = ?Intermediate = ?Full-sizedHa: Not all the population means are equal.H0: ?Compact = ?Intermediate = ?Full-sizedHa: ?Compact ≠ ?Intermediate ≠ ?Full-sizedH0:…arrow_forwardWrite a report of the different research design with exceptional of experimental research design.arrow_forward
- An important issue in conservation biology is how dispersal among populations influences the persistence of species in a fragmented landscape. Molofsky and Ferdy (2005) measured this in the annual plant, Cardamine pensylvanica, a weed that produces explosively dispersed seeds. Four treatments were used to manipulate seed dispersal by changing the distance among experimental plant populations. These treatments were adjacent (continuous treatment), separated by 23.2 cm (medium), separated by 49.5 cm (long), or separated by partitions that blocked all seed dispersal among populations (isolated). Treatments were randomly assigned to plant populations. The data shown are the number of generations that the populations persisted in six replicates of each treatment. Test whether the persistence of species differ with distance among experimental plant populations at 5% significance level. Conduct a follow up analysis when necessary. Treatment Generations persisted Isolated 9 8 8 8 8 Medium 14…arrow_forwardAssume we have data demonstrating a strong linear link between the amount of fertilizer applied to certain plants and their yield. Which is the independent variable in this research question?arrow_forwardUsing satellite imagery to aid agriculture grain production has been done on a limited scale as far back as the 1970's when NASA first launched the Landsat satellite. But it has only been recently that the satellite images, including GPS satellites, and data from typical farm operations have been integrated together to provide a data driven innovative technology that improves the efficiency and productivity on farms. In one study samples were taken on wheat yields in the State of Washington which historically had average yields of 35.6 bushels per acre with a standard deviation of 3.7 bushels per acre. Suppose that a random sample of the wheat yields on 40 different farms was taken and the sample mean for the wheat yields was computed, and you are interested in a probability about the sample mean. 28. Pick the equation most appropriate to deal with the problem above. a) p(x) = (nCx) p*(1-P)"-* b) x = μ + zo c) z= x-μ of √n d) z = x-μ O 29. If the sample mean is 34.8 bushels of wheat,…arrow_forward
- Although a research study is typically conducted with a relatively small group of participants known as a most researchers hope to generalize their results to a much larger group known as aarrow_forwardA survey of high school students was done to examine whether students had ever driven a car after consuming a substantial amount of alcohol (1=yes, 0=no). Data was collected on their sex (male/female), race (White/non-White), and grade level (9,10,11,12). Researchers realized that the impact of race on consuming alcohol before driving might vary by grade level and decided to fit the following model. Variable Coding = 1 if Intercept Sex () Female Race () Black Grade level ( 9th grade 10th grade 11th grade [Reference = 12th grade] Attached is the logistic model 1. Compute the OR of drinking before driving for students who self-reported as Black versus non-Black in the 9th grade, adjusting for gender. 2. Compute the OR of drinking before driving for students who self-reported as Black versus non-Black in the 12th grade, adjusting for gender. 3. Compute the OR of drinking before driving for someone in the 9th grade versus 12th grade for a student who…arrow_forwardThe data for lab 1-2 was created based upon the paper by the STARSproject and modified by Dr. Hole. Fast food meals are typically high incalories, fat, sodium and cholesterol, which are known to increase the riskof obesity and diabetes. Researchers found that unhealthy ingredients,large portion size, low cost, and convenience make fast food cause obesity.The dataset provided by Dr. Hole is derived from a very large consumersurvey conducted by market researchers at Milward Brown. The survey wascarried out using a CATI (computer Aided Telephone Interviewing)methodology. Random digit telephone numbers were dialed and theperson answering was asked “Do you buy fast food nowadays?” Only thoseresponding “Yes” were then surveyed. In class, we already examined thedatasets, found results, and drew tables to answer several questions.Dataset: Lab 1-2.savRequirements: For your 1-2 assignment, please provide scholarly tables and your findings/thoughts with reasonable justification for the following…arrow_forward
 Linear Algebra: A Modern IntroductionAlgebraISBN:9781285463247Author:David PoolePublisher:Cengage Learning
 Big Ideas Math A Bridge To Success Algebra 1: Stu...AlgebraISBN:9781680331141Author:HOUGHTON MIFFLIN HARCOURTPublisher:Houghton Mifflin Harcourt