
Concept explainers
Videos
a
To graph: Graph and find the linear model and quadratic model for the data.
a
Explanation of Solution
Given information:
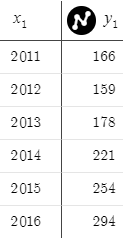
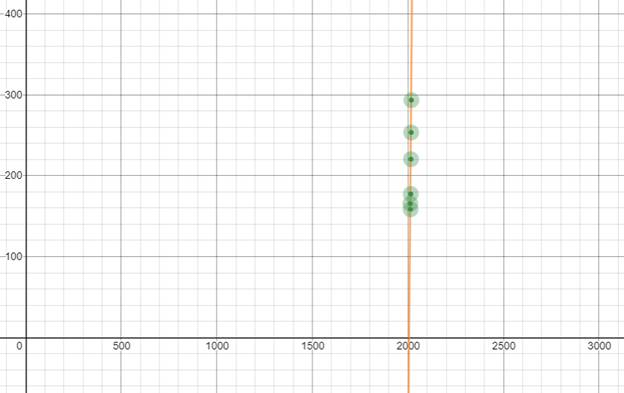
Graph : linear regression graph
Quadratic regression graph
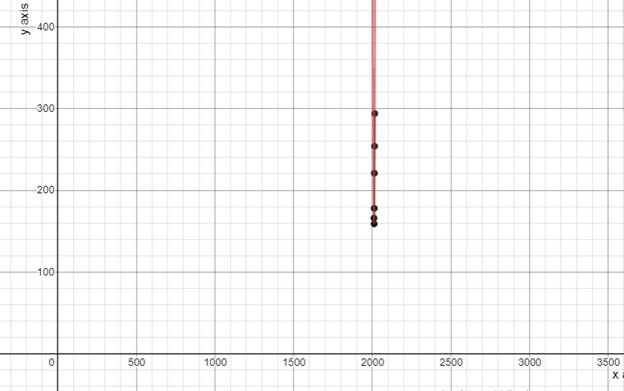
Interpretation : A quadratic model finds the equation of the parabola that best fits the set of data and its equation is given by
Linear regression is used to predict the relationship between two variables and is given by the formula
We will define the value of R square to get the best fit line from both the graph.
b
To calculate: calculate which graph best fit the data.
b
Answer to Problem 22E
Since the value of R square is more nearer to one in quadratic model that is
Explanation of Solution
Given information: 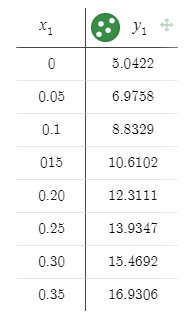
Formula used: A quadratic model finds the equation of the parabola that best fits the set of data and its equation is given by
Linear regression is used to predict the relationship between two variables and is given by the formula
Calculation:
From above graph the respective values of quadratic model are
Therefore the equation of the quadratic model is given by,
Now the respective values of linear model are
Therefore the equation of the quadratic model is given by,
Since the value of R square is more nearer to one in quadratic model , therefore quadratic model will best suit for the best fit line.
Chapter 2 Solutions
PRECALCULUS W/LIMITS:GRAPH.APPROACH(HS)


 Calculus: Early TranscendentalsCalculusISBN:9781285741550Author:James StewartPublisher:Cengage Learning
 Thomas' Calculus (14th Edition)CalculusISBN:9780134438986Author:Joel R. Hass, Christopher E. Heil, Maurice D. WeirPublisher:PEARSON
 Calculus: Early Transcendentals (3rd Edition)CalculusISBN:9780134763644Author:William L. Briggs, Lyle Cochran, Bernard Gillett, Eric SchulzPublisher:PEARSON
 Calculus: Early TranscendentalsCalculusISBN:9781319050740Author:Jon Rogawski, Colin Adams, Robert FranzosaPublisher:W. H. Freeman
 Calculus: Early Transcendental FunctionsCalculusISBN:9781337552516Author:Ron Larson, Bruce H. EdwardsPublisher:Cengage Learning