
Concept explainers
Videos
a
To draw
a
Explanation of Solution
Given information:
Graph:
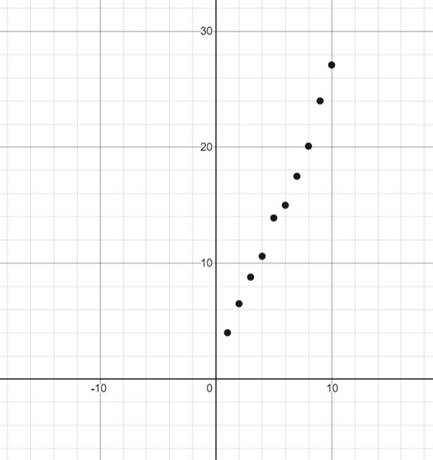
Interpretation:
Using a graphic utility, the scatter plot for the given data is shown above.
b
To find if the scatter plot could be modeled by linear model, quadratic model or neither.
b
Answer to Problem 13E
Linear model
Explanation of Solution
Given information:
To determine if the given graph can be modeled by linear model, quadratic model or neither of them, try to draw a straight line or a parabola through the given scatter plot.
If a straight line can be drawn through the points of the scatter plot, it could be modelled by linear model whereas if a parabola can be drawn through the points of the scatter plot, it could be modelled by a quadratic model.
In case if both are not possible, it could neither be modeled.
Here, in the given graph we could draw a straight line. Therefore, the scatter plot could be modeled by a linear model.
Conclusion:
Therefore, given scatter plot is modeled by linear model.
c
To find a model for the data using regression feature of a graphing utility.
c
Answer to Problem 13E
Linear model
Explanation of Solution
Given information:
Calculation:
Using the graphic utility to find the regression,
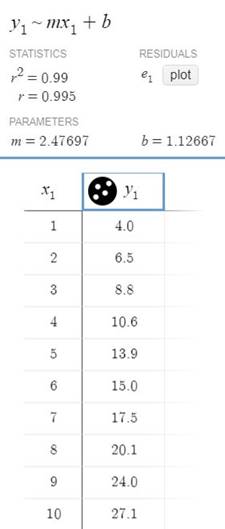
Conclusion:
Therefore, from the above figure. the regression equation for the linear model is
d
To draw the model with the scatter plot from subpart (a) using a graphic utility.
d
Explanation of Solution
Given information:
Graph:
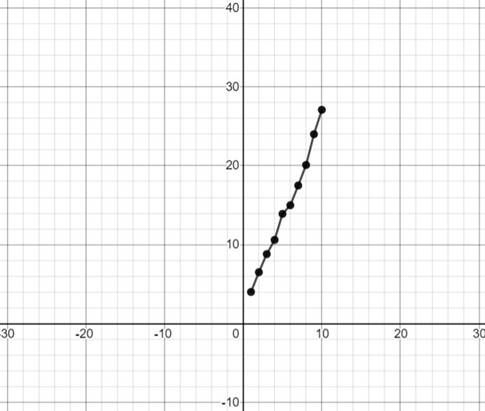
Interpretation:
Using a graphic utility, a straight line is formed when the data is kept on a graph.
e
To draw a table comparing the original data with the data given by the model.
e
Explanation of Solution
Given information:
Table:
Draw the table comparing the original data and the data given by the model.
| Original data | Data from the model | ||
| x | y | ||
| 1 | 4.0 | 1 | 3.60364 |
| 2 | 6.5 | 2 | 6.08061 |
| 3 | 8.8 | 3 | 8.55758 |
| 4 | 10.6 | 4 | 11.03455 |
| 5 | 13.9 | 5 | 13.51152 |
| 6 | 15.0 | 6 | 15.98849 |
| 7 | 17.5 | 7 | 18.46546 |
| 8 | 20.1 | 8 | 20.94243 |
| 9 | 24.0 | 9 | 23.4194 |
| 10 | 27.1 | 10 | 25.89637 |
Data from the model is obtained by substituting the values of x as
Interpretation:
When the original data and the data from the model are compared with each other, it is found that the values are nearly equal.
Chapter 2 Solutions
PRECALCULUS W/LIMITS:GRAPH.APPROACH(HS)


 Calculus: Early TranscendentalsCalculusISBN:9781285741550Author:James StewartPublisher:Cengage Learning
 Thomas' Calculus (14th Edition)CalculusISBN:9780134438986Author:Joel R. Hass, Christopher E. Heil, Maurice D. WeirPublisher:PEARSON
 Calculus: Early Transcendentals (3rd Edition)CalculusISBN:9780134763644Author:William L. Briggs, Lyle Cochran, Bernard Gillett, Eric SchulzPublisher:PEARSON
 Calculus: Early TranscendentalsCalculusISBN:9781319050740Author:Jon Rogawski, Colin Adams, Robert FranzosaPublisher:W. H. Freeman
 Calculus: Early Transcendental FunctionsCalculusISBN:9781337552516Author:Ron Larson, Bruce H. EdwardsPublisher:Cengage Learning