
Videos
(a)
To explain is there evidence that after training players can throw strikes than
(a)
Answer to Problem 27E
There is sufficient evidence to support the claim that after training players can throw strikes than
Explanation of Solution
The table of number of strikes before and after is given in the question. It is also given that,
Now, the sample mean and the standard deviation of the number of strikes are as follows:
Let us now define the hypotheses as:
Now the degree of freedom is then as:
Thus, the value of the test statistics is then as:
Thus, the P-value can be calculated using table T of appendix F as:
As we know that the P-value is less than the significance level then the null hypothesis is rejected. Thus, we have,
Thus, we conclude that there is sufficient evidence to support the claim that after training players can throw strikes than
(b)
To explain is there evidence that the training is effective in improving a player’s ability to throw strikes.
(b)
Answer to Problem 27E
There is no sufficient evidence to support the claim that the training is effective in improving a player’s ability to throw strikes.
Explanation of Solution
The table of number of strikes before and after is given in the question. It is also given that,
And we will find the difference between the two samples as:
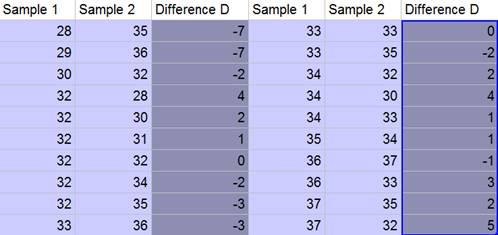
Now, the sample mean and the standard deviation of the difference are as follows:
Let us now define the hypotheses as:
Now the degree of freedom is then as:
Thus, the value of the test statistics is then as:
Thus, the P-value can be calculated using table T of appendix F as:
As we know that the P-value is less than the significance level then the null hypothesis is rejected. Thus, we have,
Thus, we conclude that there is no sufficient evidence to support the claim that the training is effective in improving a player’s ability to throw strikes.
Chapter 25 Solutions
Stats: Modeling the World Nasta Edition Grades 9-12
Additional Math Textbook Solutions
Elementary Statistics
Statistics for Business and Economics (13th Edition)
STATS:DATA+MODELS-W/DVD
Introductory Statistics
Elementary Statistics (13th Edition)
Essentials of Statistics, Books a la Carte Edition (5th Edition)


 MATLAB: An Introduction with ApplicationsStatisticsISBN:9781119256830Author:Amos GilatPublisher:John Wiley & Sons Inc
 Probability and Statistics for Engineering and th...StatisticsISBN:9781305251809Author:Jay L. DevorePublisher:Cengage Learning
 Statistics for The Behavioral Sciences (MindTap C...StatisticsISBN:9781305504912Author:Frederick J Gravetter, Larry B. WallnauPublisher:Cengage Learning
 Elementary Statistics: Picturing the World (7th E...StatisticsISBN:9780134683416Author:Ron Larson, Betsy FarberPublisher:PEARSON
 The Basic Practice of StatisticsStatisticsISBN:9781319042578Author:David S. Moore, William I. Notz, Michael A. FlignerPublisher:W. H. Freeman
 Introduction to the Practice of StatisticsStatisticsISBN:9781319013387Author:David S. Moore, George P. McCabe, Bruce A. CraigPublisher:W. H. Freeman