
Concept explainers
Videos
(a)
To explain is there evidence that cars get significantly better fuel economy with premium gasoline.
(a)
Answer to Problem 22E
There is sufficient evidence to support the claim that there evidence that cars get significantly better fuel economy with premium gasoline.
Explanation of Solution
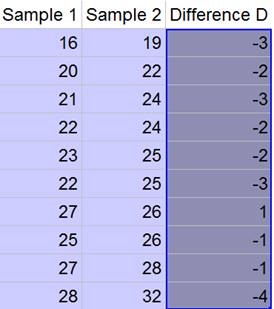
The table of the cars with the two different gasoline, regular and premium, is given in the question. It is also given that,
And we will find the difference between the two samples as:
Now, the sample mean and the standard deviation of the difference are as follows:
Let us now define the hypotheses as:
Now the degree of freedom is then as:
Thus, the value of the test statistics is then as:
Thus, the P-value can be calculated using table T of appendix F as:
As we know that the P-value is less than the significance level then the null hypothesis is rejected. Thus, we have,
Thus, we conclude that there is sufficient evidence to support the claim that there evidence that cars get significantly better fuel economy with premium gasoline.
(b)
To find out how big that difference be and check out a
(b)
Answer to Problem 22E
The confidence interval is
Explanation of Solution
The table of the cars with the two different gasoline, regular and premium, is given in the question. It is also given that,
And we will find the difference between the two samples as:

Now, the sample mean and the standard deviation of the difference are as follows:
Now the degree of freedom is then as:
So, let us find out the critical value using table T in appendix F with degree of freedom as:
And then the confidence interval be as:
Thus, the difference might be then in between
(c)
To explain why might the company choose to stick with the regular gasoline.
(c)
Explanation of Solution
The table of the cars with the two different gasoline, regular and premium, is given in the question. It is also given that,
And we will find the difference between the two samples as:

Thus, the difference might be then in between
(d)
To explain what would the significant test have found if you have mistakenly taken the data as two independent samples instead of matched pair and carefully explain why the results are so different.
(d)
Answer to Problem 22E
There is no sufficient evidence to support the claim that there evidence that cars get significantly better fuel economy with premium gasoline.
Explanation of Solution
If we suppose we have mistakenly taken the data as two independent samples instead of matched pair, then it would be as:
The mean of the regular and premium gasoline can be calculated as:
And the standard deviation of the premium and regular gasoline can be calculated as:
Let us now define the hypotheses as:
And the test statistics value will be then as:
And the degrees of freedom is calculated as:
Thus, the P-value is the number in the column title of table T in appendix F containing t -value in the row of degree of freedom as:
And we know that the P-value is less than the significance level then the null hypothesis is rejected. Thus, we have,
Thus, we conclude that there is no sufficient evidence to support the claim that there evidence that cars get significantly better fuel economy with premium gasoline. Thus, the result are so different because the difference between the mean of each group are a lot larger than the mean of the difference of each paired value.
Chapter 25 Solutions
Stats: Modeling the World Nasta Edition Grades 9-12
Additional Math Textbook Solutions
STATS:DATA+MODELS-W/DVD
Fundamentals of Statistics (5th Edition)
Intro Stats, Books a la Carte Edition (5th Edition)
Statistics for Psychology
Elementary Statistics Using Excel (6th Edition)
Statistics for Business and Economics (13th Edition)


 MATLAB: An Introduction with ApplicationsStatisticsISBN:9781119256830Author:Amos GilatPublisher:John Wiley & Sons Inc
 Probability and Statistics for Engineering and th...StatisticsISBN:9781305251809Author:Jay L. DevorePublisher:Cengage Learning
 Statistics for The Behavioral Sciences (MindTap C...StatisticsISBN:9781305504912Author:Frederick J Gravetter, Larry B. WallnauPublisher:Cengage Learning
 Elementary Statistics: Picturing the World (7th E...StatisticsISBN:9780134683416Author:Ron Larson, Betsy FarberPublisher:PEARSON
 The Basic Practice of StatisticsStatisticsISBN:9781319042578Author:David S. Moore, William I. Notz, Michael A. FlignerPublisher:W. H. Freeman
 Introduction to the Practice of StatisticsStatisticsISBN:9781319013387Author:David S. Moore, George P. McCabe, Bruce A. CraigPublisher:W. H. Freeman