
Concept explainers
Videos
(a)
To identify the procedure you would use to assess the effectiveness of the exercise program and check to see if the conditions allow the use of that procedure.
(a)
Answer to Problem 19E
The procedure we will use to assess the effectiveness of the exercise program is paired t -test and all the conditions are met.
Explanation of Solution
The table for the workers for the company is given in which scores of the workers are given for the job satisfaction before and after the program is mentioned. Thus, to access the effectiveness of the exercise program we will use the paired t -test as it is used if the two groups contain the same subjects or pairs related subjects. But the two-sample t -test is used if the subjects of the two groups are not related. Thus, in this case we will use the paired t -test. And the conditions for the procedure are as follows:
Random condition: It is satisfied because the ten workers were randomly selected.
Independent condition: It is satisfied assuming that the ten workers are less than the
Normal condition: It is satisfied because the distribution is symmetric and uni-modal.
Thus, all the conditions for this test are met.
(b)
To test an appropriate hypothesis and state your conclusion.
(b)
Answer to Problem 19E
There is sufficient evidence to support the claim that the job satisfaction improves.
Explanation of Solution
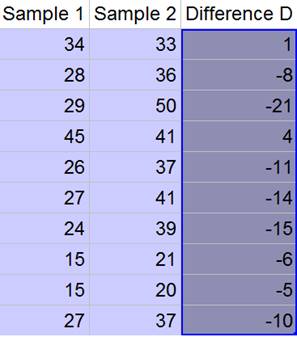
The table for the workers for the company is given in which scores of the workers are given for the job satisfaction before and after the program is mentioned. Thus, we note that,
And we will find the difference between the two samples as:
Now, the sample mean and the standard deviation of the difference are as follows:
Let us now define the hypotheses as:
Now the degree of freedom is then as:
Thus, the value of the test statistics will be then:
Thus, the P-value can be calculated using table T of appendix F as:
As we know that the P-value is less than the significance level then the null hypothesis is rejected. Thus, we have,
Thus, we conclude that there is sufficient evidence to support the claim that the job satisfaction improves.
(c)
To find out what kind of error you had commit if your conclusion turns out to be incorrect.
(c)
Answer to Problem 19E
If our conclusion turns out to be incorrect then it will lead to the Type I error.
Explanation of Solution
The table for the workers for the company is given in which scores of the workers are given for the job satisfaction before and after the program is mentioned. From part (b) we have that,
As we know that the P-value is less than the significance level then the null hypothesis is rejected. Thus, we have,
Thus, we conclude that there is sufficient evidence to support the claim that the job satisfaction improves. Thus,
Type I error: Reject the null hypothesis when the null hypothesis is true.
Type II error: Fail to reject the null hypothesis when the null hypothesis is false.
Thus, if our conclusion turns out to be incorrect then it will lead to the Type I error.
Chapter 25 Solutions
Stats: Modeling the World Nasta Edition Grades 9-12
Additional Math Textbook Solutions
Essentials of Statistics (6th Edition)
Introductory Statistics (2nd Edition)
Statistics for Business and Economics (13th Edition)
Elementary Statistics
Fundamentals of Statistics (5th Edition)
An Introduction to Mathematical Statistics and Its Applications (6th Edition)


 MATLAB: An Introduction with ApplicationsStatisticsISBN:9781119256830Author:Amos GilatPublisher:John Wiley & Sons Inc
 Probability and Statistics for Engineering and th...StatisticsISBN:9781305251809Author:Jay L. DevorePublisher:Cengage Learning
 Statistics for The Behavioral Sciences (MindTap C...StatisticsISBN:9781305504912Author:Frederick J Gravetter, Larry B. WallnauPublisher:Cengage Learning
 Elementary Statistics: Picturing the World (7th E...StatisticsISBN:9780134683416Author:Ron Larson, Betsy FarberPublisher:PEARSON
 The Basic Practice of StatisticsStatisticsISBN:9781319042578Author:David S. Moore, William I. Notz, Michael A. FlignerPublisher:W. H. Freeman
 Introduction to the Practice of StatisticsStatisticsISBN:9781319013387Author:David S. Moore, George P. McCabe, Bruce A. CraigPublisher:W. H. Freeman