
Concept explainers
Videos
(a)
To write a
(a)
Answer to Problem 23E
The mean dry pavements stopping distance is between
Explanation of Solution
The table of the cars whose tires are tested for dry and wet pavements are given in the question. Thus, now let us first check the conditions and assumptions for inference are as follows:
Random condition: It is satisfied because we are assuming that the cars were randomly selected.
Independent condition: It is satisfied because the cars are different.
Normal condition: It is satisfied because the histogram of the data is roughly symmetric and uni-modal.
Thus, all the conditions for the data are satisfied.
Now, let us calculate the mean and standard deviation of the dry pavements for the cars as:
And the degree of freedom will be as:
Now let us find out the t -value by looking in the row starting with degree of freedom and in table T of appendix F is as:
Now the confidence interval will be as:
Thus, we conclude that the mean dry pavements stopping distance is between
(b)
To write a
(b)
Answer to Problem 23E
We are
Explanation of Solution
The table of the cars whose tires are tested for dry and wet pavements are given in the question. Thus, now let us first check the conditions and assumptions for inference are as follows:
Random condition: It is satisfied because we are assuming that the cars were randomly selected.
Independent condition: It is satisfied because the cars are different.
Normal condition: It is satisfied because the histogram of the data is roughly symmetric and uni-modal.
Thus, all the conditions for the data are satisfied.
It is also given that,
And we will find the difference between the two samples as:
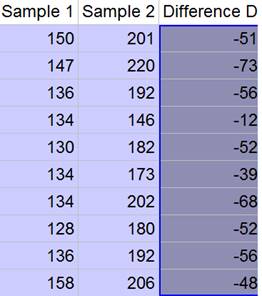
Now, the sample mean and the standard deviation of the difference are as follows:
Now the degree of freedom is then as:
Now let us find out the t -value by looking in the row starting with degree of freedom and in table T of appendix F is as:
Now the confidence interval will be as:
Thus, we conclude that we are
Chapter 25 Solutions
Stats: Modeling the World Nasta Edition Grades 9-12
Additional Math Textbook Solutions
Fundamentals of Statistics (5th Edition)
Basic Business Statistics, Student Value Edition (13th Edition)
Elementary Statistics: Picturing the World (6th Edition)
Introductory Statistics (10th Edition)
Statistical Reasoning for Everyday Life (5th Edition)
Intro Stats, Books a la Carte Edition (5th Edition)


 MATLAB: An Introduction with ApplicationsStatisticsISBN:9781119256830Author:Amos GilatPublisher:John Wiley & Sons Inc
 Probability and Statistics for Engineering and th...StatisticsISBN:9781305251809Author:Jay L. DevorePublisher:Cengage Learning
 Statistics for The Behavioral Sciences (MindTap C...StatisticsISBN:9781305504912Author:Frederick J Gravetter, Larry B. WallnauPublisher:Cengage Learning
 Elementary Statistics: Picturing the World (7th E...StatisticsISBN:9780134683416Author:Ron Larson, Betsy FarberPublisher:PEARSON
 The Basic Practice of StatisticsStatisticsISBN:9781319042578Author:David S. Moore, William I. Notz, Michael A. FlignerPublisher:W. H. Freeman
 Introduction to the Practice of StatisticsStatisticsISBN:9781319013387Author:David S. Moore, George P. McCabe, Bruce A. CraigPublisher:W. H. Freeman