
Concept explainers
Videos
Housing Price Index. Realtors use an index to compare housing prices in major cities. The index numbers for several cities are given in the table below. In Exercises 25–32, use the following to find the price of a home in the given town.
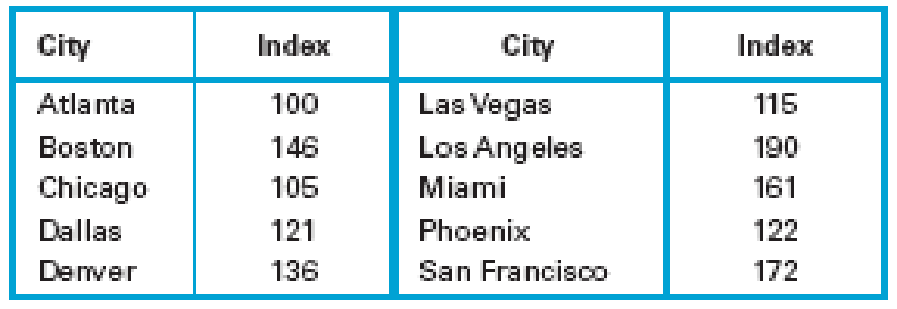
30. Las Vegas and San Francisco. If a house is valued at $375,000 in San Francisco, find the price of a comparable house in Las Vegas.
Want to see the full answer?
Check out a sample textbook solution
Chapter 2 Solutions
Statistical Reasoning for Everyday Life (5th Edition)


- The table to the right gives the cost of living index (COLI) for six East Coast counties and six Midwest counties (using an index where 100 represents the average cost of living for all participating cities with a population of more than 1.5 million). Answer parts (a) through (e) below. East Coast Counties Midwest Counties A 104.1 U 96.4 B 128.3 V 92.7 C 314.5 W 94.2 D 134.9 X 87.5 E 123.8 Y 95.8 F 141.1 Z 228.3 The table to the right gives the cost of living index (COLI) for six East Coast counties and six Midwest counties (using an index where 100 represents the average cost of living for all participating cities with a population of more than 1.5 million). Answer parts (a) through (e) below. East Coast Counties Midwest Counties A 104.1 U 96.4 B 128.3 V 92.7 C 314.5 W 94.2 D 134.9 X 87.5 E 123.8 Y 95.8 F 141.1 Z…arrow_forwardCritical Thinking. For Exercises 5–20, watch out for these little buggers. Each of these exercises involves some feature that is somewhat tricky. Find the (a) mean, (b) median, (c) mode, (d) midrange, and then answer the given question. Football Player Numbers Listed below are the jersey numbers of 11 players randomly selected from the roster of the Seattle Seahawks when they won Super Bowl XLVIII. What do the results tell us?arrow_forwardThe table to the right gives the cost of living index (COLI) for six East Coast counties and six Midwest counties (using an index where 100 represents the average cost of living for all participating cities with a population of more than 1.5 million). Answer parts (a) through (e) below. East Coast Counties Midwest Counties A 104.5 U 96.3 B 128.4 V 92.5 C 314.2 W 94.3 D 134.2 X 87.5 E 123.2 Y 95.5 F 141.2 Z 228.4 a. Find the mean, median, and range for each of the two data sets. The mean for the East Coast Counties is . (Type an integer or decimal rounded to two decimal places asneeded.)arrow_forward
- C. Describe the four characteristics of associationarrow_forwardThe boxplot below shows salaries for Construction workers and Teachers. Construction Teacher E 20 25 30 35 40 Salary (thousands of $) They are making more than Question Help: Video If a person is making the minimum salary for a construction worker, they are making more than what percentage of Teachers? Submit Question 45 50 Search + 55 % of Teachers. Enter an integer or decimal number [more..]arrow_forwardClassification of Data Identify the individuals and give the variables under the following: 1. You want to study about the people who climbed Mt. Everest. 2. The Department of Agriculture wishes to conduct a study about the pineapples in Tagaytay.arrow_forward
- The boxplots below show the real estate values of single-family homes in two neighboring cities (in thousands of dollars). Statstown Medianville 0 20 40 60 80 100 120 140 Annual Income Which city has more households? A. Statstown B. O Medianville C. O Both cities have the same number of households. D. It is impossible to tell from the boxplots.arrow_forwardWhich model appears to be the best accordingly? A. Model I B. Model II C. Model III D. Model IVarrow_forwardDuring one shift, the express lane clerk recorded how many times customers violated the "10 items or less" rule for his lane. In particular, he recorded how many items over the limit each violator placed on the conveyor belt. This data is summarized in the histogram below. NOTE: The last class actually represents "7 or more items," not just 7 items. 14+ 12 10- 8- 6- 4 0.5 1.5 2.5 3.5 4.5 5.5 6.5 7.5 # items over 10 What is the most frequent number of over-the-limit items for this data set? ans = What is the frequency of the most frequent number of over-the-limit items? ans = Frequency 2.arrow_forward
- 4. The data below represent the number of fatal commercial airline incidents in the United States foreach year from 1998–2011. Find the mode.1 2 3 6 0 2 2 3 2 1 2 1 0 0 5. The table shows the list of average high temperatures in degrees Farenheit for each of the month ofthe year on an island country. Find the mode. Month Jan Feb Mar Apr May Jun Jul Aug Sep Oct Nov Dec 81 82 82 83 85 86 87 87 87 86 84 82 6. Five hundred college graduates were asked how much they donate to their alma mater on an annualbasis. Find the mode of the responses. Responses Frequency$500 or more 45Between 0 to $500 150Nothing 275Refused to answer 30 7. The data shows the number of losses by the team that won the NCAA men’s basketball championshipfor the year…arrow_forwardA company has experienced recent monthly sales of 100 (January), 150 (February), 140 (March), 130 (April), and 170 (May). Using a 3-month moving average, the projected sales value for June is closest to Group of answer choices. 138 147 300 230 (Ctr)- Styles Iarrow_forwardOn May 3, 1999, 59 tornadoes hit a certain state in the largest tornado outbreak ever recorded for that state. Sixteen of these were classified as strong (F2 or F3) or violent (F4 or F5). Answer parts a through c below. Length of Length of Length of Path (miles) Intensity Path (miles) Intensity Path (miles) Intensity F3 F3 F3 F2 F2 F3 F5 F2 F2 F3 45 5 9 4 37 6 13 0 I 8 6 15 40 1 20 45 NNIIN F2 F2 F4 F4 a. Make a box-and-whisker plot of the data for length of path. Choose the correct plot below. A. O B. O C. F2 F3 15 8 14 3 45arrow_forward
 MATLAB: An Introduction with ApplicationsStatisticsISBN:9781119256830Author:Amos GilatPublisher:John Wiley & Sons Inc
 Probability and Statistics for Engineering and th...StatisticsISBN:9781305251809Author:Jay L. DevorePublisher:Cengage Learning
 Statistics for The Behavioral Sciences (MindTap C...StatisticsISBN:9781305504912Author:Frederick J Gravetter, Larry B. WallnauPublisher:Cengage Learning
 Elementary Statistics: Picturing the World (7th E...StatisticsISBN:9780134683416Author:Ron Larson, Betsy FarberPublisher:PEARSON
 The Basic Practice of StatisticsStatisticsISBN:9781319042578Author:David S. Moore, William I. Notz, Michael A. FlignerPublisher:W. H. Freeman
 Introduction to the Practice of StatisticsStatisticsISBN:9781319013387Author:David S. Moore, George P. McCabe, Bruce A. CraigPublisher:W. H. Freeman