
Statistical Reasoning for Everyday Life (5th Edition)
5th Edition
ISBN: 9780134494043
Author: Jeff Bennett, William L. Briggs, Mario F. Triola
Publisher: PEARSON
expand_more
expand_more
format_list_bulleted
Concept explainers
Videos
Textbook Question
Chapter 2.4, Problem 21E
Pizza Cost and Subway Fare. The “pizza connection” refers to the observation that in New York City, the cost of a slice of pizza is always about the same as the subway fare. In Exercises 21–24, use the CPI values from Table 2.2 and the data in the following table.
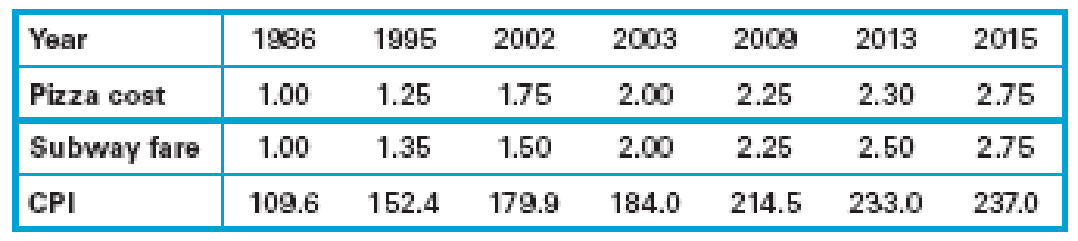
21. Cost of Pizza in 2010. Using the CPI values from the above table and Table 2.2, determine what a slice of pizza should have cost in 2010 if it cost $1.00 in 1986 and prices had risen with the CPI. What does this tell you about how actual pizza prices changed compared to the CPI?
Expert Solution & Answer
Want to see the full answer?
Check out a sample textbook solution
Students have asked these similar questions
Data is given
The accompanying table includes only countries in the top ten in a certain year for both production and consumption of energy . (Energy units are quadrillion Btu.) Population is for midyear of a certain year, in millions . The given box plot shows consumption in quadrillion Btu. Complete parts (a) through (c) below.
please help
Researchers initiated a long-term study of the pòpulation of American black bears. One aspect of the study was to develop a model that could be used to predict a bear's weight (since it is not practical to weigh bears in the field). One variable
thought to be related to weight is the length of the bear. The accompanying data represent the lengths and weights of 12 American black bears. Complete parts (a) through (d) below.
Click here to view the data table Click here to view the critical values table.
(a) Which variable is the explanatory variable based on the goals of the research?
O A. The length of the bear
B. The weight of the bear
C. The number of bears
(b) Draw a scatter diagram of the data. Choose the correct graph below.
O B.
OD.
O A.
С.
AWeight (kg)
180-
ALength (cm)
180-
AWeight (kg)
180-
AWeight (kg)
180-
401
100
Length (cm)
40-
100
Weight (kg)
40+
100
40+
100
200
200
200
200
Length (cm)
Length (cm)
(c) Determine the linear correlation coefficient between weight and length.…
Chapter 2 Solutions
Statistical Reasoning for Everyday Life (5th Edition)
Ch. 2.1 - Qualitative versus Quantitative. What is the...Ch. 2.1 - Discrete versus Continuous. Distinguish between...Ch. 2.1 - Measurement Levels. What do we mean by data at the...Ch. 2.1 - Interval versus Ratio. Explain why temperatures on...Ch. 2.1 - Does It Make Sense? For Exercises 58, determine...Ch. 2.1 - Does It Make Sense? For Exercises 58, determine...Ch. 2.1 - Does It Make Sense? For Exercises 58, determine...Ch. 2.1 - Does It Make Sense? For Exercises 58, determine...Ch. 2.1 - Does It Make Sense? For Exercises 58, determine...Ch. 2.1 - Does It Make Sense? For Exercises 58, determine...
Ch. 2.1 - Does It Make Sense? For Exercises 58, determine...Ch. 2.1 - Does It Make Sense? For Exercises 58, determine...Ch. 2.1 - Does It Make Sense? For Exercises 58, determine...Ch. 2.1 - Does It Make Sense? For Exercises 58, determine...Ch. 2.1 - Does It Make Sense? For Exercises 58, determine...Ch. 2.1 - Does It Make Sense? For Exercises 58, determine...Ch. 2.1 - Qualitative versus Quantitative Data. In Exercises...Ch. 2.1 - Qualitative versus Quantitative Data. In Exercises...Ch. 2.1 - Discrete or Continuous. In Exercises 1928, state...Ch. 2.1 - Discrete or Continuous. In Exercises 1928, state...Ch. 2.1 - Discrete or Continuous. In Exercises 1928, state...Ch. 2.1 - Discrete or Continuous. In Exercises 1928, state...Ch. 2.1 - Discrete or Continuous. In Exercises 1928, state...Ch. 2.1 - Discrete or Continuous. In Exercises 1928, state...Ch. 2.1 - Discrete or Continuous. In Exercises 1928, state...Ch. 2.1 - Discrete or Continuous. In Exercises 1928, state...Ch. 2.1 - Discrete or Continuous. In Exercises 1928, state...Ch. 2.1 - Discrete or Continuous. In Exercises 1928, state...Ch. 2.1 - Levels of Measurement. For the data described in...Ch. 2.1 - Levels of Measurement. For the data described in...Ch. 2.1 - Levels of Measurement. For the data described in...Ch. 2.1 - Levels of Measurement. For the data described in...Ch. 2.1 - Levels of Measurement. For the data described in...Ch. 2.1 - Levels of Measurement. For the data described in...Ch. 2.1 - Levels of Measurement. For the data described in...Ch. 2.1 - Levels of Measurement. For the data described in...Ch. 2.1 - Levels of Measurement. For the data described in...Ch. 2.1 - Levels of Measurement. For the data described in...Ch. 2.1 - Levels of Measurement. For the data described in...Ch. 2.1 - Levels of Measurement. For the data described in...Ch. 2.1 - Meaningful Ratios? In Exercises 4148, determine...Ch. 2.1 - Meaningful Ratios? In Exercises 4148, determine...Ch. 2.1 - Meaningful Ratios? In Exercises 4148, determine...Ch. 2.1 - Meaningful Ratios? In Exercises 4148, determine...Ch. 2.1 - Meaningful Ratios? In Exercises 4148, determine...Ch. 2.1 - Meaningful Ratios? In Exercises 4148, determine...Ch. 2.1 - Meaningful Ratios? In Exercises 4148, determine...Ch. 2.1 - Meaningful Ratios? In Exercises 4148, determine...Ch. 2.1 - Complete Classification. In Exercises 4956,...Ch. 2.1 - Complete Classification. In Exercises 4956,...Ch. 2.1 - Complete Classification. In Exercises 4956,...Ch. 2.1 - Complete Classification. In Exercises 4956,...Ch. 2.1 - Prob. 53ECh. 2.1 - Complete Classification. In Exercises 4956,...Ch. 2.1 - Prob. 55ECh. 2.1 - Complete Classification. In Exercises 4956,...Ch. 2.2 - Error Type. Distinguish between random errors and...Ch. 2.2 - Absolute and Relative. Distinguish between the...Ch. 2.2 - Accuracy and Precision. Distinguish between...Ch. 2.2 - Honest Numbers. Why can it be misleading to give...Ch. 2.2 - Does It Make Sense? For Exercises 58, determine...Ch. 2.2 - Does It Make Sense? For Exercises 58, determine...Ch. 2.2 - Does It Make Sense? For Exercises 58, determine...Ch. 2.2 - Does It Make Sense? For Exercises 58, determine...Ch. 2.2 - IRS. An IRS agent reviews tax returns to identify...Ch. 2.2 - Safe Air Travel. Before taking off, a pilot is...Ch. 2.2 - Technical Specifications. A smartphone battery is...Ch. 2.2 - Crime Statistics. Former New York City Police...Ch. 2.2 - Sources of Errors. For each measurement described...Ch. 2.2 - Sources of Errors. For each measurement described...Ch. 2.2 - Sources of Errors. For each measurement described...Ch. 2.2 - Sources of Errors. For each measurement described...Ch. 2.2 - Sources of Errors. For each measurement described...Ch. 2.2 - Sources of Errors. For each measurement described...Ch. 2.2 - Sources of Errors. For each measurement described...Ch. 2.2 - Sources of Errors. For each measurement described...Ch. 2.2 - Absolute and Relative Errors. In Exercises 2124,...Ch. 2.2 - Absolute and Relative Errors. In Exercises 2124,...Ch. 2.2 - Absolute and Relative Errors. In Exercises 2124,...Ch. 2.2 - Absolute and Relative Errors. In Exercises 2124,...Ch. 2.2 - Minimizing Errors. Twenty-five people, including...Ch. 2.2 - Minimizing Errors. When a model 22F car battery is...Ch. 2.2 - Accuracy and Precision in Corvette Weight. A new...Ch. 2.2 - Accuracy and Precision in Height. Assume that your...Ch. 2.2 - Accuracy and Precision in Weight. Suppose your...Ch. 2.2 - Prob. 30ECh. 2.2 - Believable Facts? Exercises 3138 give statements...Ch. 2.2 - Believable Facts? Exercises 3138 give statements...Ch. 2.2 - Prob. 33ECh. 2.2 - Believable Facts? Exercises 3138 give statements...Ch. 2.2 - Prob. 35ECh. 2.2 - Believable Facts? Exercises 3138 give statements...Ch. 2.2 - Believable Facts? Exercises 3138 give statements...Ch. 2.2 - Believable Facts? Exercises 3138 give statements...Ch. 2.3 - Statistical Literacy and Critical Thinking...Ch. 2.3 - Percentage Difference. Distinguish between...Ch. 2.3 - Of versus More Than. Explain the difference...Ch. 2.3 - Percentage Points. Explain the difference between...Ch. 2.3 - Does It Make Sense? For Exercises 58, determine...Ch. 2.3 - Does It Make Sense? For Exercises 58, determine...Ch. 2.3 - Does It Make Sense? For Exercises 58, determine...Ch. 2.3 - Does It Make Sense? For Exercises 58, determine...Ch. 2.3 - Concepts and Applications Fractions, Decimals,...Ch. 2.3 - Fractions, Decimals, Percentages. Express the...Ch. 2.3 - Percentage Practice. A study was conducted of...Ch. 2.3 - Percentage Practice. A study was conducted to...Ch. 2.3 - Percentage of Media commonly report survey...Ch. 2.3 - Percentage. A New York Times editorial criticized...Ch. 2.3 - Relative Change. Exercises 1522 each provide two...Ch. 2.3 - Relative Change. Exercises 1522 each provide two...Ch. 2.3 - Relative Change. Exercises 1522 each provide two...Ch. 2.3 - Relative Change. Exercises 1522 each provide two...Ch. 2.3 - Relative Change. Exercises 1522 each provide two...Ch. 2.3 - Relative Change. Exercises 1522 each provide two...Ch. 2.3 - Relative Change. Exercises 1522 each provide two...Ch. 2.3 - Relative Change. Exercises 1522 each provide two...Ch. 2.3 - Surveys. Some important analyses of survey results...Ch. 2.3 - Surveys. Some important analyses of survey results...Ch. 2.3 - Surveys. Some important analyses of survey results...Ch. 2.3 - Surveys. Some important analyses of survey results...Ch. 2.3 - Of versus More Than. Fill in the blanks in...Ch. 2.3 - Of versus More Than. Fill in the blanks in...Ch. 2.3 - Of versus More Than. Fill in the blanks in...Ch. 2.3 - Of versus More Than. Fill in the blanks in...Ch. 2.3 - Margin of Error. A Gallup poll of 1012 American...Ch. 2.3 - Margin of Error. A Pew Research Center survey of...Ch. 2.3 - Percentages of Percentages. Exercises 3336...Ch. 2.3 - Percentages of Percentages. Exercises 3336...Ch. 2.3 - Percentages of Percentages. Exercises 3336...Ch. 2.3 - Percentages of Percentages. Exercises 3336...Ch. 2.3 - TV Share. A recent Super Bowl football game had a...Ch. 2.3 - Misleading Percentage. In a Gallup poll of 1236...Ch. 2.4 - Index Number. What is an index number? Briefly...Ch. 2.4 - CPI. What is the Consumer Price Index (CPI)? How...Ch. 2.4 - Inflation. In making price comparisons, why is it...Ch. 2.4 - CPI Change. If the CPI increases, must wages also...Ch. 2.4 - Does It Make Sense? For Exercises 58, determine...Ch. 2.4 - Does It Make Sense? For Exercises 58, determine...Ch. 2.4 - Does It Make Sense? For Exercises 58, determine...Ch. 2.4 - Does It Make Sense? For Exercises 58, determine...Ch. 2.4 - Consumer Price Index. In Exercises 916, use the...Ch. 2.4 - Consumer Price Index. In Exercises 916, use the...Ch. 2.4 - Consumer Price Index. In Exercises 916, use the...Ch. 2.4 - Consumer Price Index. In Exercises 916, use the...Ch. 2.4 - Prob. 13ECh. 2.4 - Consumer Price Index. In Exercises 916, use the...Ch. 2.4 - Consumer Price Index. In Exercises 916, use the...Ch. 2.4 - Consumer Price Index. In Exercises 916, use the...Ch. 2.4 - Coffee Index. In Exercises 1720, use the following...Ch. 2.4 - Prob. 18ECh. 2.4 - Prob. 19ECh. 2.4 - Coffee Index. In Exercises 1720, use the following...Ch. 2.4 - Pizza Cost and Subway Fare. The pizza connection...Ch. 2.4 - Pizza Cost and Subway Fare. The pizza connection...Ch. 2.4 - Pizza Cost and Subway Fare. The pizza connection...Ch. 2.4 - Pizza Cost and Subway Fare. The pizza connection...Ch. 2.4 - Prob. 25ECh. 2.4 - Prob. 26ECh. 2.4 - Prob. 27ECh. 2.4 - Housing Price Index. Realtors use an index to...Ch. 2.4 - Prob. 29ECh. 2.4 - Housing Price Index. Realtors use an index to...Ch. 2.4 - Prob. 31ECh. 2.4 - Housing Price Index. Realtors use an index to...Ch. 2 - Germs. In a Wakefield Research survey, 1003...Ch. 2 - Health Care Spending. Total spending on health...Ch. 2 - Prob. 3CRECh. 2 - Minimum Wage. The following table lists the...Ch. 2 - Braking reaction times of 36 randomly selected...Ch. 2 - What is the level of measurement of the values...Ch. 2 - Prob. 3CQCh. 2 - A researcher measures the braking reaction time of...Ch. 2 - Braking reaction times of 36 randomly selected...Ch. 2 - Recorded survey results include the states in...Ch. 2 - Prob. 7CQCh. 2 - Prob. 8CQCh. 2 - Prob. 9CQCh. 2 - Prob. 10CQCh. 2 - Politics Who Benefited Most from Lower Tax Rates?...Ch. 2 - Prob. 1.2FCh. 2 - Prob. 1.3F
Knowledge Booster


Learn more about
Need a deep-dive on the concept behind this application? Look no further. Learn more about this topic, statistics and related others by exploring similar questions and additional content below.Similar questions
- AS3. NO1. DATA ANALYSISarrow_forwardx 11.8, 8.1, 6.8, 3.8, 2.5, 2.7, 2.4, 0.7 y 14, 10.7, 10, 7.6, 6, 6.1, 6.2, 4.3 This data is modeled by equation y = 0.86 x + 3.95. a. How many murders per 100,000 residents can be expected in a state with 1.1 thousand automatic weapons? Round to 3 decimals b. How many murders per 100,000 residents can be expected in a state with 3.4 thousand automatic weapons? Round to 3 decimalsarrow_forwardWorld Military Expenditure The following chart shows total military and arms trade expenditure from 2011–2020 (t = 1 represents 2011). †A bar graph titled "World military expenditure" has a horizontal t-axis labeled "Year since 2010" and a vertical axis labeled "$ (billions)". The bar graph has 10 bars. Each bar is associated with a label and an approximate value as listed below. 1: 1,800 billion dollars 2: 1,775 billion dollars 3: 1,750 billion dollars 4: 1,730 billion dollars 5: 1,760 billion dollars 6: 1,760 billion dollars 7: 1,850 billion dollars 8: 1,900 billion dollars 9: 1,950 billion dollars 10: 1,980 billion dollars (a) If you want to model the expenditure figures with a function of the form f(t) = at2 + bt + c, would you expect the coefficient a to be positive or negative? Why? HINT [See "Features of a Parabola" in this section.] We would expect the coefficient to be positive because the curve is concave up. We would expect the coefficient to be negative because the…arrow_forward
- The scatter plot gives the average atmospheric concentration of a gas and the average global temperature for six selected years. Shown on the scatter plot is a line that passes through or near the six points. Use this line to answer the questions in parts a. to d. (A calculator is recommended.) Concentration of a Gas and Global Temperature 58.2- 58.0- (383,57 94) 57.8- 57.6- a. Use the two points whose coordinates are shown on the graph to write the point-slope form of the line that models the average global temperature, y, for an atmospheric gas concentration of x parts per million. 57.4- 57.2- 429-57-04) The point-slope form of the equation is (Simplify your answer. Use integers or decimals for any numbers in the equation, Round to two decimal places as needed.) 57.0- 56.8+ 310 320 330 340 350 360 370 380 390 Average Concentration of a Gas Aver age Global Temperature in Degre esarrow_forwardThe mean of the data 18, 15, 19, a, 18 is 19. Find the value of T.arrow_forwardwhat is the independent and dependent variable in the sentence below? How many calories do Filipino men andwomen consume per day?arrow_forward
- Which statement best describes the data represented in box plotsarrow_forwardClassification of Data Identify the individuals and give the variables under the following: 1. You want to study about the people who climbed Mt. Everest. 2. The Department of Agriculture wishes to conduct a study about the pineapples in Tagaytay.arrow_forwardThe table below shows the number of state-registered automatic weapons and the murder rate for several Northwestern states. 11.5 8.4 6.8 3.4 2.5 2.6 2.6 0.9 13.5 10.9 9.8 6.7 6.3 6.4 4.5 x = thousands of automatic weapons y = murders per 100,000 residents This data can be modeled by the equation 0.83x + 3.99. Use this equation to answer the following; Special Note: I suggest you verify this equation by performing linear regression on your calculator. A) How many murders per 100,000 residents can be expected in a state with 8.4 thousand automatic weapons? Answer Round to 3 decimal places. B) How many murders per 100,000 residents can be expected in a state with 7.3 thousand automatic weapons? Answer Round to 3 decimal places.arrow_forward
- Give a single example in which you can explain both 1. Qualitative and quantitative data 2. Continuous and discrete dataarrow_forwardCan you help me solve this question. I include the data chart along with itarrow_forwardCan you view the data below and explain what is the relationship between the frequency and total gross sales (the total gross sales are from different movie theater sales) and the frequency equals the weeks in which those sales were done.arrow_forward
arrow_back_ios
SEE MORE QUESTIONS
arrow_forward_ios
Recommended textbooks for you
 Glencoe Algebra 1, Student Edition, 9780079039897...AlgebraISBN:9780079039897Author:CarterPublisher:McGraw Hill
 Big Ideas Math A Bridge To Success Algebra 1: Stu...AlgebraISBN:9781680331141Author:HOUGHTON MIFFLIN HARCOURTPublisher:Houghton Mifflin Harcourt
Glencoe Algebra 1, Student Edition, 9780079039897...
Algebra
ISBN:9780079039897
Author:Carter
Publisher:McGraw Hill
Big Ideas Math A Bridge To Success Algebra 1: Stu...
Algebra
ISBN:9781680331141
Author:HOUGHTON MIFFLIN HARCOURT
Publisher:Houghton Mifflin Harcourt
The Shape of Data: Distributions: Crash Course Statistics #7; Author: CrashCourse;https://www.youtube.com/watch?v=bPFNxD3Yg6U;License: Standard YouTube License, CC-BY
Shape, Center, and Spread - Module 20.2 (Part 1); Author: Mrmathblog;https://www.youtube.com/watch?v=COaid7O_Gag;License: Standard YouTube License, CC-BY
Shape, Center and Spread; Author: Emily Murdock;https://www.youtube.com/watch?v=_YyW0DSCzpM;License: Standard Youtube License