
ELEMENTARY STATISTICS MANUAL
2nd Edition
ISBN: 9781260017809
Author: NAVIDI MONK
Publisher: McGraw-Hill Publishing Co.
expand_more
expand_more
format_list_bulleted
Concept explainers
Videos
Textbook Question
Chapter 2.2, Problem 15E
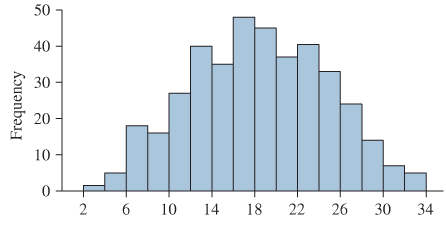
In Exercises 13—16, classify the histogram as skewed to the left, skewed to the right, or approximately symmetric.
Expert Solution & Answer
Want to see the full answer?
Check out a sample textbook solution
Students have asked these similar questions
draw a histogram that is symmetric but not mound-shaped
In the real world, what kinds of data are distributed in
the shape of a bell curve? Cite examples of how the
Bell Curve has been used that you think are good, or
bad, or neutral.
The histogram below gives the length of service of members of the Department of Chemistry at a particular university. The classes, in years of service, are 0−−4.9, 5−−9.9, etc., and the vertical axis represents the number of faculty.
(a) What percent of the department faculty have 25 or more years of service?
(b) If a member of the department is chosen at random to serve on a university committee, what is the probability (in decimal form) that the chosen representitive will have between 5 and 35 years of service?
(c) What is the probability the representative above will have less than 30 years of service given that the person has less than 35 years of service?
Chapter 2 Solutions
ELEMENTARY STATISTICS MANUAL
Ch. 2.1 - In Exercises 5-8, fill in each blank with the...Ch. 2.1 - In Exercises 5-8, fill in each blank with the...Ch. 2.1 - In Exercises 5-8, fill in each blank with the...Ch. 2.1 - In Exercises 5-8, fill in each blank with the...Ch. 2.1 - In Exercises 9—12, determine whether the...Ch. 2.1 - In Exercises 9—12, determine whether the...Ch. 2.1 - In Exercises 9—12, determine whether the...Ch. 2.1 - In Exercises 9—12, determine whether the...Ch. 2.1 - The following bar graph presents the average...Ch. 2.1 - The most common blood typing system divides human...
Ch. 2.1 - Following is a pie chart that presents the...Ch. 2.1 - Prob. 16ECh. 2.1 - Food sources: The following side-by-side bar graph...Ch. 2.1 - Prob. 18ECh. 2.1 - Prob. 19ECh. 2.1 - Popular video games: The following frequency...Ch. 2.1 - More iPods: Using the data in exercise 19:...Ch. 2.1 - Prob. 22ECh. 2.1 - Prob. 23ECh. 2.1 - World population: Following are the populations of...Ch. 2.1 - Ages of video garners: The Nielsen Company...Ch. 2.1 - How secure is your job? In a survey, employed...Ch. 2.1 - Back up your data: In a survey commissioned by the...Ch. 2.1 - Education levels: The following frequency...Ch. 2.1 - Music sales: The following frequency distribution...Ch. 2.1 - Bought a new car lately? The following table...Ch. 2.1 - Instagram followers: The following frequency...Ch. 2.1 - Smartphones: The following table present the...Ch. 2.1 - Smartphone sale: The following table presents the...Ch. 2.1 - Happy Halloween: The following table presents...Ch. 2.1 - Native languages: The following frequency...Ch. 2.2 - Prob. 5ECh. 2.2 - In Exercises 5—8, fill in each blank with the...Ch. 2.2 - In Exercises 5—8, fill in each blank with the...Ch. 2.2 - In Exercises 5—8, fill in each blank with the...Ch. 2.2 - In Exercises 9—12, determine whether the...Ch. 2.2 - In Exercises 9—12, determine whether the...Ch. 2.2 - In Exercises 9—12, determine whether the...Ch. 2.2 - In Exercises 9—12, determine whether the...Ch. 2.2 - In Exercises 13—16, classify the histogram as...Ch. 2.2 - In Exercises 13—16, classify the histogram as...Ch. 2.2 - In Exercises 13—16, classify the histogram as...Ch. 2.2 - In Exercises 13—16, classify the histogram as...Ch. 2.2 - In Exercises 17 and 18, classify the histogram as...Ch. 2.2 - In Exercises 17 and 18, classify the histogram as...Ch. 2.2 - Student heights: The following frequency histogram...Ch. 2.2 - Trained rats: Forty rats were trained to run a...Ch. 2.2 - Prob. 21ECh. 2.2 - Prob. 22ECh. 2.2 - Prob. 23ECh. 2.2 - Prob. 24ECh. 2.2 - Batting average: The following frequency...Ch. 2.2 - Batting average: The following frequency...Ch. 2.2 - Time spent playing video games: A sample of 200...Ch. 2.2 - Murder, she wrote: The following frequency...Ch. 2.2 - BMW prices: The following table presents the...Ch. 2.2 - Geysers: The geyser Old Faithful in Yellowstone...Ch. 2.2 - Hail to the chief: There have been 58 presidential...Ch. 2.2 - Internet radio: The following table presents the...Ch. 2.2 - Brothers and sisters: Thirty students in a...Ch. 2.2 - Cough, cough: The following table presents the...Ch. 2.2 - Prob. 35ECh. 2.2 - Frequency polygon: Using the data in Exercise 26:...Ch. 2.2 - Frequency polygon: Using data in Exercise 27:...Ch. 2.2 - Prob. 38ECh. 2.2 - Ogive: Using the data in Exercise 25 Compute the...Ch. 2.2 - Ogive: Using the data in Exercise 26: Compute the...Ch. 2.2 - Ogive: Using the data in Exercise 27: Compute the...Ch. 2.2 - Prob. 42ECh. 2.2 - Prob. 43ECh. 2.2 - Prob. 44ECh. 2.2 - Prob. 45ECh. 2.2 - Prob. 46ECh. 2.2 - Prob. 47ECh. 2.2 - Prob. 48ECh. 2.3 - In Exercises 3—6, fill in each blank with the...Ch. 2.3 - In Exercises 3—6, fill in each blank with the...Ch. 2.3 - In Exercises 3—6, fill in each blank with the...Ch. 2.3 - In Exercises 3—6, fill in each blank with the...Ch. 2.3 - Prob. 7ECh. 2.3 - In Exercises 7—10, determine whether the...Ch. 2.3 - In Exercises 7—10, determine whether the...Ch. 2.3 - In Exercises 7—10, determine whether the...Ch. 2.3 - Construct a stem-and-leaf plot for the following...Ch. 2.3 - Construct a stem-and-leaf plot for the following...Ch. 2.3 - List the data in the following stem-and-leaf plot....Ch. 2.3 - List the data in the following stein-and-leaf...Ch. 2.3 - Construct a dotplot for the data in Exercise 11.Ch. 2.3 - Prob. 16ECh. 2.3 - BMW prices: The following table presents the...Ch. 2.3 - Hows the weather? The following table presents the...Ch. 2.3 - Air pollution: The following table presents...Ch. 2.3 - Technology salaries: The following table presents...Ch. 2.3 - Tennis and golf: Following are the ages of the...Ch. 2.3 - Pass the popcorn: Following are the running times...Ch. 2.3 - More weather: Construct a dotplot for the data in...Ch. 2.3 - Prob. 24ECh. 2.3 - Prob. 25ECh. 2.3 - Prob. 26ECh. 2.3 - Prob. 27ECh. 2.3 - Prob. 28ECh. 2.3 - Prob. 29ECh. 2.3 - Prob. 30ECh. 2.3 - Prob. 31ECh. 2.3 - Prob. 32ECh. 2.3 - Prob. 33ECh. 2.3 - Article ice sheet: the following table presents...Ch. 2.3 - Prob. 35ECh. 2.4 - In Exercises 3 and 4, fill in each blank with the...Ch. 2.4 - In Exercises 3 and 4, fill in each blank with the...Ch. 2.4 - CD sales decline: Sales of CDs have been declining...Ch. 2.4 - Prob. 6ECh. 2.4 - Prob. 7ECh. 2.4 - Prob. 8ECh. 2.4 - Prob. 9ECh. 2.4 - Prob. 10ECh. 2.4 - Prob. 11ECh. 2.4 - Age at marriage: Data compiled by the U.S. Census...Ch. 2.4 - College degrees: Both of the following time-series...Ch. 2.4 - Prob. 14ECh. 2.4 - Prob. 15ECh. 2 - Following is the list of letter grades for...Ch. 2 - Prob. 2CQCh. 2 - Construct a frequency bar graph for the data in...Ch. 2 - Prob. 4CQCh. 2 - Prob. 5CQCh. 2 - Prob. 6CQCh. 2 - Prob. 7CQCh. 2 - Prob. 8CQCh. 2 - Prob. 9CQCh. 2 - Prob. 10CQCh. 2 - Following are the prices (in dollars) for a sample...Ch. 2 - Prob. 12CQCh. 2 - Prob. 13CQCh. 2 - Prob. 14CQCh. 2 - Prob. 15CQCh. 2 - Trust your doctor: The General Social Survey...Ch. 2 - Internet browsers: The following relative...Ch. 2 - Prob. 3RECh. 2 - Prob. 4RECh. 2 - Prob. 5RECh. 2 - House freshmen: Newly elected members of the U.S....Ch. 2 - More freshmen: For the data in Exercise 6:...Ch. 2 - Royalty: Following are the ages at death for all...Ch. 2 - Prob. 9RECh. 2 - Prob. 10RECh. 2 - Prob. 11RECh. 2 - Prob. 12RECh. 2 - Prob. 13RECh. 2 - Prob. 14RECh. 2 - Falling birth rate: The following time-series...Ch. 2 - Explain why the frequency bar graph and the...Ch. 2 - Prob. 2WAICh. 2 - Prob. 3WAICh. 2 - Prob. 4WAICh. 2 - Prob. 5WAICh. 2 - In the chapter introduction, we presented gas...Ch. 2 - In the chapter introduction, we presented gas...Ch. 2 - In the chapter introduction, we presented gas...Ch. 2 - Prob. 4CSCh. 2 - In the chapter introduction, we presented gas...Ch. 2 - Prob. 6CSCh. 2 - In the chapter introduction, we presented gas...Ch. 2 - Prob. 8CSCh. 2 - In the chapter introduction, we presented gas...
Knowledge Booster


Learn more about
Need a deep-dive on the concept behind this application? Look no further. Learn more about this topic, statistics and related others by exploring similar questions and additional content below.Similar questions
- A person's resting heart rate decreases with an increase in cardiovascular activity creating a negative correlation. The points on a corresponding scatter diagram a. form a circle. b. have an unknown pattern. c. tend to move downward from left to right. d. tend to move upward from left to right.arrow_forwardReview the data in the Table 1, entitled, "Average Annual Salaries for Bachelor of Science Graduates, Summer 2016-Spring 2017". Using this data, create a chart (with a title, labeled axes, and a legend) comparing the average salaries that you could use to guide high school students who want salary influence the type of engineering major that they will choose. Consider, which fields tend to make the most money? Write a recommendation letter addressed to a high school student who wants to select an engineering field based on the salary; using a comparison of the data, recommend which majors they should most closely consider. Engineering - Average Annual Salaries & Hourly Wages for Undergraduates by Program, Summer 2016-Spring 2017 Average Annual Salaries for Bachelor of Science Graduates, Summer 2016-Spring 2017 | Offers/Acceptances with Salary Information 31 Average Annual Salaries $66,356 All Program Aeronautical & Astronautical Engineering Aviation Biomedical Engineering Chemical…arrow_forward(b) Plot the following ordered pairs on a recta (1,-12.2),(2,-4.4),(3,9.4) (4,28.1),(5,49.8),(6,58.3) (7,62.2),(8,57.4),(9,45.7) (10,23.1),(11,5.4),(12,-11.7)arrow_forward
- Which type of plot would be most useful for visualizing the relationship between 'Age' and job satisfaction 'Score'? a. histogram b. single box plot c. side by side box plot d. scatter plot e. dot plotarrow_forwardGive me an explanation of what is taught by the chart ?arrow_forwardThe data in the figure below represents the number of stars earned by 140 performers in a talent competition.How many performers earned exactly 0 stars? (be careful... the y-axis represents the PERCENTAGE of the total number of performers. Ex: 30% of 140 would = 140 * 0.30 = 42)arrow_forward
- The data represent the heights in feet and the number of stories of the tallest buildings in a city. Height, x Stories, y 947 57 708 52 658 46 529 40 450 31 446 28 430 24 420 26 419 32 Scatter Plot for the Heights (in Feet) and Number of Stories of the Buildings. y 10 20 30 40 50 60 70 80 90 x 100 200 300 400 500 600 700 800 900 0 Part: 0 / 3 0 of 3 Parts Complete Part 1 of 3 Find the value for r . Round your answer to at least three decimal places. r ≈ 0.942 Part: 1 / 3 1 of 3 Parts Complete Part 2 of 3 Test the significance of r at the 5% level and at the 1% level. Sample Size 5% 1% Sample Size 5% 1% 4 .950 .990 17 .482 .606 5 .878 .959 18 .468 .590 6…arrow_forwardThe students in a class collected data on the number of minutes some of them spend brushing their teeth every day. That data is shown in the dot plot below. BRUSHING TEETHBRUSHING TEETH 0.511.522.533.544.5 Time Brushing (minutes) What was the shortest time someone spent brushing their teeth? minutesarrow_forwardMake a histogram of the following data by hand on paper and upload a picture of your histogram. Make sure to label the horizontal and vertical axis. The test scores of 30 math students for the final exam were recorded: Scores Frequency 50-59 5 60-69 7 70-79 3 80-89 10 90-100 5arrow_forward
- Need help with the last answer in the red box as it is wrong.arrow_forwardData: 3.5, 3.2, 3.1, 3.5, 3.6, 3.2, 3.4, 2.9, 4.1, 2.6, 3.3, 3.5, 3.9, 3.8, 3.7, 3.4, 3.6, 3.5, 3.5, 3.7, 3.6, 3.8, 3.2, 3.4, 4.2, 3.6, 3.1, 2.9, 2.5, 3.5, 3.1, 3.2, 3.7, 3.8, 3.4, 3.6, 3.5, 3.2, 3.6, 3.8 Sketch a histogram with ranges of 0.1, from minimum (2.5) to maximum (4.2) values. Then sketch a histogram with ranges of 0.3. You can include the relative frequency scales on the same sketches.arrow_forwardb) Plot a scatterplot with coastal ocean surface temperature (horizontal axis) and costal air temperature (vertical axis). Interpret the output.arrow_forward
arrow_back_ios
SEE MORE QUESTIONS
arrow_forward_ios
Recommended textbooks for you
 Holt Mcdougal Larson Pre-algebra: Student Edition...AlgebraISBN:9780547587776Author:HOLT MCDOUGALPublisher:HOLT MCDOUGAL
 Algebra: Structure And Method, Book 1AlgebraISBN:9780395977224Author:Richard G. Brown, Mary P. Dolciani, Robert H. Sorgenfrey, William L. ColePublisher:McDougal Littell
 Big Ideas Math A Bridge To Success Algebra 1: Stu...AlgebraISBN:9781680331141Author:HOUGHTON MIFFLIN HARCOURTPublisher:Houghton Mifflin Harcourt
 Algebra and Trigonometry (MindTap Course List)AlgebraISBN:9781305071742Author:James Stewart, Lothar Redlin, Saleem WatsonPublisher:Cengage Learning
 College AlgebraAlgebraISBN:9781305115545Author:James Stewart, Lothar Redlin, Saleem WatsonPublisher:Cengage Learning
 Glencoe Algebra 1, Student Edition, 9780079039897...AlgebraISBN:9780079039897Author:CarterPublisher:McGraw Hill
Holt Mcdougal Larson Pre-algebra: Student Edition...
Algebra
ISBN:9780547587776
Author:HOLT MCDOUGAL
Publisher:HOLT MCDOUGAL
Algebra: Structure And Method, Book 1
Algebra
ISBN:9780395977224
Author:Richard G. Brown, Mary P. Dolciani, Robert H. Sorgenfrey, William L. Cole
Publisher:McDougal Littell
Big Ideas Math A Bridge To Success Algebra 1: Stu...
Algebra
ISBN:9781680331141
Author:HOUGHTON MIFFLIN HARCOURT
Publisher:Houghton Mifflin Harcourt
Algebra and Trigonometry (MindTap Course List)
Algebra
ISBN:9781305071742
Author:James Stewart, Lothar Redlin, Saleem Watson
Publisher:Cengage Learning
College Algebra
Algebra
ISBN:9781305115545
Author:James Stewart, Lothar Redlin, Saleem Watson
Publisher:Cengage Learning
Glencoe Algebra 1, Student Edition, 9780079039897...
Algebra
ISBN:9780079039897
Author:Carter
Publisher:McGraw Hill
The Shape of Data: Distributions: Crash Course Statistics #7; Author: CrashCourse;https://www.youtube.com/watch?v=bPFNxD3Yg6U;License: Standard YouTube License, CC-BY
Shape, Center, and Spread - Module 20.2 (Part 1); Author: Mrmathblog;https://www.youtube.com/watch?v=COaid7O_Gag;License: Standard YouTube License, CC-BY
Shape, Center and Spread; Author: Emily Murdock;https://www.youtube.com/watch?v=_YyW0DSCzpM;License: Standard Youtube License