
ELEMENTARY STATISTICS MANUAL
2nd Edition
ISBN: 9781260017809
Author: NAVIDI MONK
Publisher: McGraw-Hill Publishing Co.
expand_more
expand_more
format_list_bulleted
Concept explainers
Videos
Textbook Question
Chapter 2.4, Problem 5E
CD sales decline: Sales of CDs have been declining for several years as more music is downloaded over the Internet. Following are two bar graphs that illustrate the decline in CD sales. (Source: Recording Industry Association of America)
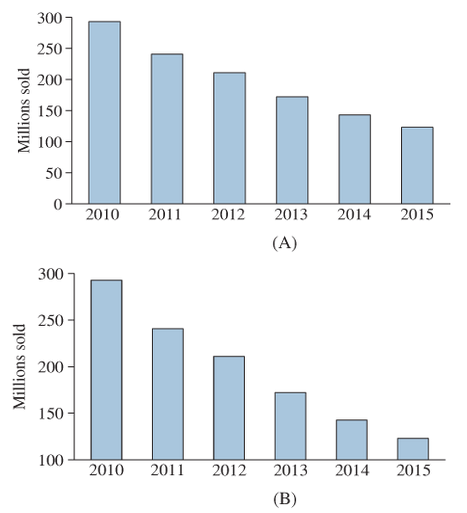
Choose one of the following options, and explain why it is correct:
(i) Graph A presents an accurate picture, and graph B exaggerates the decline.
(ii) Graph B presents an accurate picture, and graph A understates the decline.
Expert Solution & Answer
Want to see the full answer?
Check out a sample textbook solution
Students have asked these similar questions
The stacked column graph below shows
additional information from the Bureau of
Labor Statistics¹ about employment and
education for two groups of workers in the
United States compared with the graph
discussed in the in-class activity. This graph
includes data about workers aged 65 and older.
Percentage
Employment distribution of workers by education
1997 and 2007
2007
Age 65 and older
Pocholode
higher's degree.
college or associate
graduates
college
mless than a high school.
diploma
Part A: Use the graph to estimate the following information for
the Age 65 and older group and complete the following table.
2007
Age 65 and older
1997
%
%
%
%
%
%
Bachelor's degree or
higher
Some college or
associate degree
High school graduates,
no college
%
%
Less than a high
school diploma
%
AP
%
Total
A car dealership is analyzing the changes in its monthly sales. They sold 40 cars in March, 55 in April, 61 in
May, 29 in June, 63 in July, and 40 in August. Create line graph that represents this data.
3.
The following scatterplot shows the relationship between a house's area (in square feet) and its acreage, or the area of its lot. Explain the trend in context of the
graph.
Scatterplot of Acreage vs Area
500
1000
1500
2000
2500
3000
3500
Area (in square feet)
Aareage
Chapter 2 Solutions
ELEMENTARY STATISTICS MANUAL
Ch. 2.1 - In Exercises 5-8, fill in each blank with the...Ch. 2.1 - In Exercises 5-8, fill in each blank with the...Ch. 2.1 - In Exercises 5-8, fill in each blank with the...Ch. 2.1 - In Exercises 5-8, fill in each blank with the...Ch. 2.1 - In Exercises 9—12, determine whether the...Ch. 2.1 - In Exercises 9—12, determine whether the...Ch. 2.1 - In Exercises 9—12, determine whether the...Ch. 2.1 - In Exercises 9—12, determine whether the...Ch. 2.1 - The following bar graph presents the average...Ch. 2.1 - The most common blood typing system divides human...
Ch. 2.1 - Following is a pie chart that presents the...Ch. 2.1 - Prob. 16ECh. 2.1 - Food sources: The following side-by-side bar graph...Ch. 2.1 - Prob. 18ECh. 2.1 - Prob. 19ECh. 2.1 - Popular video games: The following frequency...Ch. 2.1 - More iPods: Using the data in exercise 19:...Ch. 2.1 - Prob. 22ECh. 2.1 - Prob. 23ECh. 2.1 - World population: Following are the populations of...Ch. 2.1 - Ages of video garners: The Nielsen Company...Ch. 2.1 - How secure is your job? In a survey, employed...Ch. 2.1 - Back up your data: In a survey commissioned by the...Ch. 2.1 - Education levels: The following frequency...Ch. 2.1 - Music sales: The following frequency distribution...Ch. 2.1 - Bought a new car lately? The following table...Ch. 2.1 - Instagram followers: The following frequency...Ch. 2.1 - Smartphones: The following table present the...Ch. 2.1 - Smartphone sale: The following table presents the...Ch. 2.1 - Happy Halloween: The following table presents...Ch. 2.1 - Native languages: The following frequency...Ch. 2.2 - Prob. 5ECh. 2.2 - In Exercises 5—8, fill in each blank with the...Ch. 2.2 - In Exercises 5—8, fill in each blank with the...Ch. 2.2 - In Exercises 5—8, fill in each blank with the...Ch. 2.2 - In Exercises 9—12, determine whether the...Ch. 2.2 - In Exercises 9—12, determine whether the...Ch. 2.2 - In Exercises 9—12, determine whether the...Ch. 2.2 - In Exercises 9—12, determine whether the...Ch. 2.2 - In Exercises 13—16, classify the histogram as...Ch. 2.2 - In Exercises 13—16, classify the histogram as...Ch. 2.2 - In Exercises 13—16, classify the histogram as...Ch. 2.2 - In Exercises 13—16, classify the histogram as...Ch. 2.2 - In Exercises 17 and 18, classify the histogram as...Ch. 2.2 - In Exercises 17 and 18, classify the histogram as...Ch. 2.2 - Student heights: The following frequency histogram...Ch. 2.2 - Trained rats: Forty rats were trained to run a...Ch. 2.2 - Prob. 21ECh. 2.2 - Prob. 22ECh. 2.2 - Prob. 23ECh. 2.2 - Prob. 24ECh. 2.2 - Batting average: The following frequency...Ch. 2.2 - Batting average: The following frequency...Ch. 2.2 - Time spent playing video games: A sample of 200...Ch. 2.2 - Murder, she wrote: The following frequency...Ch. 2.2 - BMW prices: The following table presents the...Ch. 2.2 - Geysers: The geyser Old Faithful in Yellowstone...Ch. 2.2 - Hail to the chief: There have been 58 presidential...Ch. 2.2 - Internet radio: The following table presents the...Ch. 2.2 - Brothers and sisters: Thirty students in a...Ch. 2.2 - Cough, cough: The following table presents the...Ch. 2.2 - Prob. 35ECh. 2.2 - Frequency polygon: Using the data in Exercise 26:...Ch. 2.2 - Frequency polygon: Using data in Exercise 27:...Ch. 2.2 - Prob. 38ECh. 2.2 - Ogive: Using the data in Exercise 25 Compute the...Ch. 2.2 - Ogive: Using the data in Exercise 26: Compute the...Ch. 2.2 - Ogive: Using the data in Exercise 27: Compute the...Ch. 2.2 - Prob. 42ECh. 2.2 - Prob. 43ECh. 2.2 - Prob. 44ECh. 2.2 - Prob. 45ECh. 2.2 - Prob. 46ECh. 2.2 - Prob. 47ECh. 2.2 - Prob. 48ECh. 2.3 - In Exercises 3—6, fill in each blank with the...Ch. 2.3 - In Exercises 3—6, fill in each blank with the...Ch. 2.3 - In Exercises 3—6, fill in each blank with the...Ch. 2.3 - In Exercises 3—6, fill in each blank with the...Ch. 2.3 - Prob. 7ECh. 2.3 - In Exercises 7—10, determine whether the...Ch. 2.3 - In Exercises 7—10, determine whether the...Ch. 2.3 - In Exercises 7—10, determine whether the...Ch. 2.3 - Construct a stem-and-leaf plot for the following...Ch. 2.3 - Construct a stem-and-leaf plot for the following...Ch. 2.3 - List the data in the following stem-and-leaf plot....Ch. 2.3 - List the data in the following stein-and-leaf...Ch. 2.3 - Construct a dotplot for the data in Exercise 11.Ch. 2.3 - Prob. 16ECh. 2.3 - BMW prices: The following table presents the...Ch. 2.3 - Hows the weather? The following table presents the...Ch. 2.3 - Air pollution: The following table presents...Ch. 2.3 - Technology salaries: The following table presents...Ch. 2.3 - Tennis and golf: Following are the ages of the...Ch. 2.3 - Pass the popcorn: Following are the running times...Ch. 2.3 - More weather: Construct a dotplot for the data in...Ch. 2.3 - Prob. 24ECh. 2.3 - Prob. 25ECh. 2.3 - Prob. 26ECh. 2.3 - Prob. 27ECh. 2.3 - Prob. 28ECh. 2.3 - Prob. 29ECh. 2.3 - Prob. 30ECh. 2.3 - Prob. 31ECh. 2.3 - Prob. 32ECh. 2.3 - Prob. 33ECh. 2.3 - Article ice sheet: the following table presents...Ch. 2.3 - Prob. 35ECh. 2.4 - In Exercises 3 and 4, fill in each blank with the...Ch. 2.4 - In Exercises 3 and 4, fill in each blank with the...Ch. 2.4 - CD sales decline: Sales of CDs have been declining...Ch. 2.4 - Prob. 6ECh. 2.4 - Prob. 7ECh. 2.4 - Prob. 8ECh. 2.4 - Prob. 9ECh. 2.4 - Prob. 10ECh. 2.4 - Prob. 11ECh. 2.4 - Age at marriage: Data compiled by the U.S. Census...Ch. 2.4 - College degrees: Both of the following time-series...Ch. 2.4 - Prob. 14ECh. 2.4 - Prob. 15ECh. 2 - Following is the list of letter grades for...Ch. 2 - Prob. 2CQCh. 2 - Construct a frequency bar graph for the data in...Ch. 2 - Prob. 4CQCh. 2 - Prob. 5CQCh. 2 - Prob. 6CQCh. 2 - Prob. 7CQCh. 2 - Prob. 8CQCh. 2 - Prob. 9CQCh. 2 - Prob. 10CQCh. 2 - Following are the prices (in dollars) for a sample...Ch. 2 - Prob. 12CQCh. 2 - Prob. 13CQCh. 2 - Prob. 14CQCh. 2 - Prob. 15CQCh. 2 - Trust your doctor: The General Social Survey...Ch. 2 - Internet browsers: The following relative...Ch. 2 - Prob. 3RECh. 2 - Prob. 4RECh. 2 - Prob. 5RECh. 2 - House freshmen: Newly elected members of the U.S....Ch. 2 - More freshmen: For the data in Exercise 6:...Ch. 2 - Royalty: Following are the ages at death for all...Ch. 2 - Prob. 9RECh. 2 - Prob. 10RECh. 2 - Prob. 11RECh. 2 - Prob. 12RECh. 2 - Prob. 13RECh. 2 - Prob. 14RECh. 2 - Falling birth rate: The following time-series...Ch. 2 - Explain why the frequency bar graph and the...Ch. 2 - Prob. 2WAICh. 2 - Prob. 3WAICh. 2 - Prob. 4WAICh. 2 - Prob. 5WAICh. 2 - In the chapter introduction, we presented gas...Ch. 2 - In the chapter introduction, we presented gas...Ch. 2 - In the chapter introduction, we presented gas...Ch. 2 - Prob. 4CSCh. 2 - In the chapter introduction, we presented gas...Ch. 2 - Prob. 6CSCh. 2 - In the chapter introduction, we presented gas...Ch. 2 - Prob. 8CSCh. 2 - In the chapter introduction, we presented gas...
Knowledge Booster


Learn more about
Need a deep-dive on the concept behind this application? Look no further. Learn more about this topic, statistics and related others by exploring similar questions and additional content below.Similar questions
- So I'll include a line graph for a second visual aid. I have a chart to show the proportion of students by major that have student loan debt at our school.arrow_forwardWhat would be a suitable chart type to show the proportions of the sales by products?arrow_forwarddraw a line graph following this information. The line graph depicts the historical and projected sales volume of Pepsi Co Jamaica's Diet Pepsi for the next fiscal year, with the horizontal axis representing the four quarters of the year, and the vertical axis representing the sales volume in million cases. The historical sales data is represented by a line that shows a sales volume of 1 million cases for the past fiscal year. The projected sales volume is represented by another line that shows an expected increase in sales volume to 1.5 million cases for the next fiscal year. The sales targets for each quarter are represented by markers or points on the graph, with the first quarter expected to reach 0.4 million cases, the second quarter at 0.5 million cases, the third quarter at 0.3 million cases, and the fourth quarter at 0.3 million cases.arrow_forward
- The bar graph shows median yearly earnings of full-time workers in the United States for people 25 years and over with a college education, by final degree earned. (See the attached graph.) The median yearly salary of an American whose final degree is a master’s is $70 thousand less than twice that of an American whose final degree is a bachelor’s. Combined, two people with each of these educational attainments earn $173 thousand. Find the median yearly salary of Americans with each of these final degrees.arrow_forwardThe graph shown below represents how the 2011 graduates of law school are doing compared to the 2007 graduates. Both the 2011 and 2007 graduating class had about 44,000 students. 80.0% 70.0% 60.0% 50.0% 40.0% 30.0% 20.0% 10.0% 0.0% 2007 2011 Employment for New Law Grads Class of 2007 vs. Class of 2011 Pt. I (National Association of Legal Placement) Full-Time Lawyer 74.1% 59.8% Full-Time Non- Lawyer 11.8% 14.9% % Part Time 4.1% 10.0% Not Working 5.8% 12.1% (a) What percentage of those Not Working in this study graduated in 2011? Note: 12.1% is not the correct answer. This does require a calculation. Back in School 2.3% 2.2% Report the answer to the nearest tenth of a percent. (b) Show calculations and explain your reasoning for this question.arrow_forwardSee uploaded picture for question.arrow_forward
- On its maiden voyage in 1912, the RMS Titanic struck an iceberg and sank in less than three hours. The table shows survival statistics. Survivors Deceased Women and Children 11 Women and Total Category First Class Second Class Third Class Children Men Men 145 54 119 329 285 24 119 142 417 15 104 105 710 69 214 706 685 1517 899 Crew Total 2223 Source: Statistics of Passengers Rescued and Lost, White Star Momentos 1. Create a graph that lawyers could use to help families of the affected passengers. Explain what type of graph you chose and why. 2. The cruise line released a statement with the headline, "Hundreds of Lives Saved in Titanic Mishap." Create a graph or highlight some data that the cruise line could use to justify this headline. 3. Reflect How do the graphs from steps 1 and 2 show that the way in which you represent information can change people's perceptions? 4. Extend Your Understanding Search the Internet for some examples of data displays that are accurate but misrepresent…arrow_forwardRice imports to the United States have steadily grown over the years, but there has been a surge in rice importation in the last two years. This data represents imports of rice for two years. 1990 1991 India 1.71 tons 3.01 tons China 5.31 tons 6.16 tons Malaysia 8.00 tons 10.67 tons S. Korea 2.16 tons 2.20 tons Thailand 4.50 tons 5.09 tons Here is a circle graph and a bar graph of the above data. Rice Imports in Metric Tons 12 I 1990 I 1991 India 10 8 China 6 Malaysia S. Korea 2 Thailand China Malaysia Which visual will be best to use to display this growth in rice imports? Thailand S. Korea O table O circle graph O spreadsheet O bar graph Indiaarrow_forwardThe graph to the right compares teaching salaries of women and men at private colleges and universities. What impression does the graph create? Does the graph depict the data fairly? If not, construct a graph that depicts the data fairly. What impression does the graph create? O A. Salaries ($) 80000- 60000- 40000- 20000- 80000- O A. The graph creates the impression that men and women have approximately the same salaries. O B. The graph creates the impression that women have salaries that are slightly higher than that of men. O C. The graph creates the impression that men have salaries that are more than twice the salaries of women. O D. The graph creates the impression that men have salaries that are slightly higher than that of women. Does the graph depict the data fairly? O A. No, because the data are two-dimensional measurements. O B. Yes, because the bars accurately represent each average. O C. No, because the vertical scale does not start at zero. O D. Yes, because the vertical…arrow_forward
- Between 1980 and 2012, the number of adults in a certain country who were overweight more than tripled from 18% to 56%. Use this information to answer parts a and b. (a) Construct a graphic that is not misleading to depict this situation. Choose the correct graph below. OA. 1980 2012 1980 2012 1980 2012 1980 2012 (b) Construct a misleading graphic that makes it appear that the percent of overweight adults has more than quadrupled between 1980 and 2012. Choose the correct graph below. O A. Oc. OD. 50 40 304 20 10 1980 2012 1980 2012 1980 2012 1980 2012 ti n deuun Percentage ateun adesundarrow_forwardHow would you graph this?arrow_forwardA graph appears below showing the number of adults and children who prefer each type of soda. There were 130 adults and kids surveyed. Discuss some ways in which the graph below could be improved.arrow_forward
arrow_back_ios
SEE MORE QUESTIONS
arrow_forward_ios
Recommended textbooks for you
 Algebra: Structure And Method, Book 1AlgebraISBN:9780395977224Author:Richard G. Brown, Mary P. Dolciani, Robert H. Sorgenfrey, William L. ColePublisher:McDougal Littell
 Glencoe Algebra 1, Student Edition, 9780079039897...AlgebraISBN:9780079039897Author:CarterPublisher:McGraw Hill
 Trigonometry (MindTap Course List)TrigonometryISBN:9781305652224Author:Charles P. McKeague, Mark D. TurnerPublisher:Cengage Learning
 Big Ideas Math A Bridge To Success Algebra 1: Stu...AlgebraISBN:9781680331141Author:HOUGHTON MIFFLIN HARCOURTPublisher:Houghton Mifflin Harcourt
 Holt Mcdougal Larson Pre-algebra: Student Edition...AlgebraISBN:9780547587776Author:HOLT MCDOUGALPublisher:HOLT MCDOUGAL
Algebra: Structure And Method, Book 1
Algebra
ISBN:9780395977224
Author:Richard G. Brown, Mary P. Dolciani, Robert H. Sorgenfrey, William L. Cole
Publisher:McDougal Littell
Glencoe Algebra 1, Student Edition, 9780079039897...
Algebra
ISBN:9780079039897
Author:Carter
Publisher:McGraw Hill
Trigonometry (MindTap Course List)
Trigonometry
ISBN:9781305652224
Author:Charles P. McKeague, Mark D. Turner
Publisher:Cengage Learning
Big Ideas Math A Bridge To Success Algebra 1: Stu...
Algebra
ISBN:9781680331141
Author:HOUGHTON MIFFLIN HARCOURT
Publisher:Houghton Mifflin Harcourt
Holt Mcdougal Larson Pre-algebra: Student Edition...
Algebra
ISBN:9780547587776
Author:HOLT MCDOUGAL
Publisher:HOLT MCDOUGAL
Continuous Probability Distributions - Basic Introduction; Author: The Organic Chemistry Tutor;https://www.youtube.com/watch?v=QxqxdQ_g2uw;License: Standard YouTube License, CC-BY
Probability Density Function (p.d.f.) Finding k (Part 1) | ExamSolutions; Author: ExamSolutions;https://www.youtube.com/watch?v=RsuS2ehsTDM;License: Standard YouTube License, CC-BY
Find the value of k so that the Function is a Probability Density Function; Author: The Math Sorcerer;https://www.youtube.com/watch?v=QqoCZWrVnbA;License: Standard Youtube License