
Understandable Statistics: Concepts and Methods
12th Edition
ISBN: 9781337119917
Author: Charles Henry Brase, Corrinne Pellillo Brase
Publisher: Cengage Learning
expand_more
expand_more
format_list_bulleted
Concept explainers
Videos
Textbook Question
Chapter 2.1, Problem 21P
Expand Your Knowledge: Decimal Data The following data represent tonnes of wheat harvested each year (1894–1925) from Plot 19 at the Rothamsted Agricultural Experiment Stations, England.
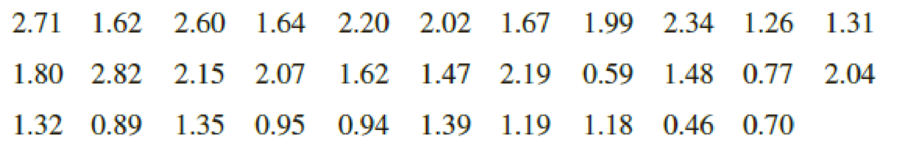
- (a) Multiply each data value by 100 to “clear” the decimals.
- (b) Use the standard procedures of this section to make a frequency table and histogram with your whole-number data. Use six classes.
- (c) Divide class limits, class boundaries, and class midpoints by 100 to get back to your original data values.
Expert Solution & Answer
Want to see the full answer?
Check out a sample textbook solution
Students have asked these similar questions
3. The number of goals scored by Wayne Gretzky was recorded for seasons 1978 – 1999.
(Please note the data set has been ordered from smallest to the largest for your convenience).
5, 9, 11, 16, 23, 23, 31, 38, 40, 40, 41, 46, 51, 52, 54, 55, 62, 71, 73, 87, 92
A. Construct a stem-and-leaf display for the data and describe the shape of the distribution (symmetric,
skewed left, skewed right, bell-shaped, etc., any obvious outliers).
B. What is the fraction of the data that is less than or equal to 31?
C. Given that Ex, = 920 and Ex = 52 436 find the mean and standard deviation.
D. Find the (i) median, (ii) Q1, (iii)Q:, (iv) the interquartile range (IQR), (v) the lower and upper
fences.
E. Construct a Box-plot for the data. What are your conclusions about the shape of the distribution?
Compare with the results in Part A.
F. Would the mean or the median be the most suitable measure to use to represent the central location
of this distribution? Give reasons for your answer.
5.
Find range for the following data:
Classes
62-64
64-66
66-68
68-70
70-72
Frequency
Solution:
5
3
4
5
3
3. Use the data set below to find the following:
Data
Frequency
Item
30
8
35
2
40
45
50
4
Chapter 2 Solutions
Understandable Statistics: Concepts and Methods
Ch. 2.1 - Statistical Literacy What is the difference...Ch. 2.1 - Statistical Literacy A data set has values ranging...Ch. 2.1 - Statistical Literacy A data set has values ranging...Ch. 2.1 - Prob. 4PCh. 2.1 - Basic Computation: Class Limits A data set with...Ch. 2.1 - Prob. 6PCh. 2.1 - Interpretation You are manager of a specialty...Ch. 2.1 - Prob. 8PCh. 2.1 - Critical Thinking Look at the histogram in Figure...Ch. 2.1 - Critical Thinking The following data represent...
Ch. 2.1 - Interpretation Histograms of random sample data...Ch. 2.1 - Prob. 12PCh. 2.1 - Interpretation The ogives shown are based on U.S....Ch. 2.1 - Prob. 14PCh. 2.1 - For Problems 15-20, use the specified number of...Ch. 2.1 - For Problems 15-20, use the specified number of...Ch. 2.1 - For Problems 15-20, use the specified number of...Ch. 2.1 - Prob. 18PCh. 2.1 - For Problems 15-20, use the specified number of...Ch. 2.1 - Prob. 20PCh. 2.1 - Expand Your Knowledge: Decimal Data The following...Ch. 2.1 - Decimal Data: Batting Averages The following data...Ch. 2.1 - Expand Your Knowledge: Dotplot Another display...Ch. 2.1 - Prob. 24PCh. 2.1 - Dotplot: Tumor Recurrence Make a dotplot for the...Ch. 2.2 - Interpretation Consider graph (a) of Reasons...Ch. 2.2 - Reasons People Like Texting on Cell Phones (b)...Ch. 2.2 - Critical Thinking A personnel office is gathering...Ch. 2.2 - Prob. 4PCh. 2.2 - Education: Does College Pay Off? It is costly in...Ch. 2.2 - Prob. 6PCh. 2.2 - Commercial Fishing: Gulf of Alaska Its not an easy...Ch. 2.2 - Prob. 8PCh. 2.2 - Lifestyle: Hide the Mess! A survey of 1000 adults...Ch. 2.2 - Prob. 10PCh. 2.2 - FBI Report: Hawaii In the Aloha state, you are...Ch. 2.2 - Prob. 12PCh. 2.2 - Prob. 13PCh. 2.2 - Prob. 14PCh. 2.2 - Prob. 15PCh. 2.2 - Prob. 16PCh. 2.3 - Cowboys: Longevity How long did real cowboys live?...Ch. 2.3 - Ecology: Habitat Wetlands offer a diversity of...Ch. 2.3 - Health Care: Hospitals The American Medical...Ch. 2.3 - Health Care: Hospitals Using the number of...Ch. 2.3 - Expand Your Knowledge: Split Stem The Boston...Ch. 2.3 - Prob. 6PCh. 2.3 - Prob. 7PCh. 2.3 - Prob. 8PCh. 2.3 - Prob. 9PCh. 2.3 - Prob. 10PCh. 2 - Prob. 1CRPCh. 2 - Critical Thinking A consumer interest group is...Ch. 2 - Prob. 3CRPCh. 2 - Prob. 4CRPCh. 2 - Prob. 5CRPCh. 2 - Prob. 6CRPCh. 2 - Prob. 7CRPCh. 2 - Prob. 8CRPCh. 2 - Prob. 9CRPCh. 2 - Prob. 10CRPCh. 2 - Prob. 11CRPCh. 2 - Prob. 12CRPCh. 2 - Prob. 1DHCh. 2 - Prob. 2DHCh. 2 - In your own words, explain the differences among...Ch. 2 - What do we mean when we say a histogram is skewed...Ch. 2 - Discuss the statement that stem-and-leaf displays...Ch. 2 - Prob. 1UTCh. 2 - Prob. 2UTCh. 2 - Prob. 3UT
Knowledge Booster


Learn more about
Need a deep-dive on the concept behind this application? Look no further. Learn more about this topic, statistics and related others by exploring similar questions and additional content below.Similar questions
- b) The amount of money earned in a day by Ms. Anne’s craft shop was recorded and displayed in the stem-and-leaf diagram shown below in Exhibit 1. Exhibit 1 Stem-and-leaf of Data: Amount of Money earned in a day in dollars Leaf Unit = 10 N = * 2 2 59 5 3 234 13 3 55779999 (**) 4 0001233 14 4 5569 *** 5 03344 5 5 7788 1 6 1 Use the stem-and-leaf diagram above to draw a box-and-whisker diagram.arrow_forwardUse the following table for problems 1–10. The numbers represent the scores (in points) for a sample of 10 college basketball games: 66 49 32 57 35 57 39 41 33 31arrow_forwardComplete the table below by giving examples for each kind of dataarrow_forward
- Use the following table to answer questions 6–9. Monthly Water Bills Jan Feb Mar Apr May June July Aug Sept Oct Nov Dec $40 $42 $40 $38 $48 $50 $58 $62 $56 $46 $44 $44 6. Write the formula for the mean water bill for the entire year using sigma notation and determine that mean. Round your answer to the nearest cent.arrow_forwardCreate a frequency table for your new variable “AGE GROUP” using the following column headings: Age Group Frequency Relative Frequency Cumulative Frequency Cumulative Relative Frequency Age 18 to 49 years 163 Age 50 to 64 years 72 Age 65 years or older 13 TOTAL 248 Which type of chart is most appropriate for displaying the frequency data for the AGE GROUP variable – bar chart or histogram? Provide a rationale for your selection. Create a frequency chart for your data. Be sure to provide a title and label your axes. Calculate the mean, standard deviation, and variance for the variable “How many caffeine drinks per day"arrow_forwardAriana holds data sets for total revenue in each year for four years. She has also analysed total revenue in each year between three product lines. She wishes to present all the data together in a component bar chart How many bars will be shown on the x axis of the chart? A. 3 B. 4 C. 12 D. 16arrow_forward
- Use StatCrunch with the vehicle counts to the right observed during a survey of a student parking lot. Complete part A below. Category of vehicle Frequency American cars 28 Japanese cars 27 English cars 6 Other European cars 12 Motorcycles 7 a. Make a frequency table for the data. Include columns for relative and cumulative frequencies, and include a row at the bottom listing the totals for each column. Complete the frequency table below. Category of vehicle Frequency Relative Frequency Cumulative Frequency American cars 28 Japanese cars 27 English cars 6 Other European cars 12 Motorcycles 7 Totalarrow_forward1. Create the frequency table of the data.arrow_forwardThe data is as follows: 2 0's, 6 1's, 10 2's, 32 3's, 50 4's, 69 5's, 50 6's, 38 7's, 19 8's, 12 9's, and 4 10's.arrow_forward
- b) The amount of money earned in a day by Ms. Anne’s craft shop was recorded and displayedin the stem-and-leaf diagram shown below in Exhibit 1.Exhibit 1Stem-and-leaf of Data: Amount of Money earned in a day indollarsLeaf Unit = 10 N = *2 2 595 3 23413 3 55779999(**) 4 000123314 4 5569*** 5 033445 5 77881 6 1(i) What is the range of the distribution? (ii) What are the values of *, ** and ***? (iii) What is the median of the distribution? (iv) Use the stem-and-leaf diagram above to draw a box-and-whisker diagram. (v) Comment on the skewness of the distribution.arrow_forward1. Find the range of the following data sets: data set a: 15, 16, 7, 5, 14, 10 data set b: 110, 125, 98, 85, 62, 100arrow_forwardRoman, a health data officer, was tasked to create a report describing the height of all the children ages 12-15 years in a small town in Rome. He measured the height of all the 37 children (ages 12-15 years) in that small town. Create a grouped frequency distribution for height(use only five classes). The columns of the frequency distribution table must contain the following. Class Limits Class Boundaries Midpoint Frequency Cumulative frequencyarrow_forward
arrow_back_ios
SEE MORE QUESTIONS
arrow_forward_ios
Recommended textbooks for you
 Holt Mcdougal Larson Pre-algebra: Student Edition...AlgebraISBN:9780547587776Author:HOLT MCDOUGALPublisher:HOLT MCDOUGAL
 Functions and Change: A Modeling Approach to Coll...AlgebraISBN:9781337111348Author:Bruce Crauder, Benny Evans, Alan NoellPublisher:Cengage Learning
 Glencoe Algebra 1, Student Edition, 9780079039897...AlgebraISBN:9780079039897Author:CarterPublisher:McGraw Hill
Holt Mcdougal Larson Pre-algebra: Student Edition...
Algebra
ISBN:9780547587776
Author:HOLT MCDOUGAL
Publisher:HOLT MCDOUGAL
Functions and Change: A Modeling Approach to Coll...
Algebra
ISBN:9781337111348
Author:Bruce Crauder, Benny Evans, Alan Noell
Publisher:Cengage Learning
Glencoe Algebra 1, Student Edition, 9780079039897...
Algebra
ISBN:9780079039897
Author:Carter
Publisher:McGraw Hill
The Shape of Data: Distributions: Crash Course Statistics #7; Author: CrashCourse;https://www.youtube.com/watch?v=bPFNxD3Yg6U;License: Standard YouTube License, CC-BY
Shape, Center, and Spread - Module 20.2 (Part 1); Author: Mrmathblog;https://www.youtube.com/watch?v=COaid7O_Gag;License: Standard YouTube License, CC-BY
Shape, Center and Spread; Author: Emily Murdock;https://www.youtube.com/watch?v=_YyW0DSCzpM;License: Standard Youtube License