
(a)
The price on the vertical axis and quantity on the horizontal axis and to plot the first two columns.
Answer to Problem 1E
Hence, the price along the vertical axis and the quantity along the horizontal axis has been determined and the first two columns have been plotted.
Explanation of Solution
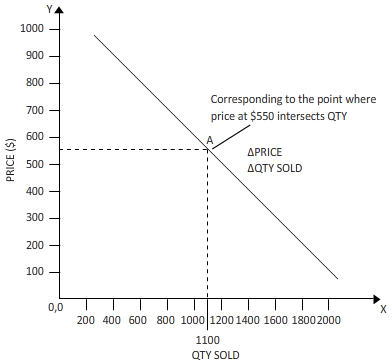
The graph is plotted by joining 3 points of price on Y-axis to the corresponding quantity sold on the X-axis.
To find the quantity sold when the price is a certain dollar, we can take the help of the line obtained by plotting 3 price point in the Y-axis to the corresponding quantity in the x-axis in the graph sheet, and join them to form a sloping straight line.
Once the new quantity is found for a particular price point from the above straight line, we can use this information to find the total revenue at that price.
(b)
The quantity sold when the price is $550.
Answer to Problem 1E
When the price is 550$, the quantity sold is 1100.
Explanation of Solution
From the above-plotted line on the graph, we find that the point when the price on Y-axis is 550$, the corresponding quantity sold on X-axis is 1100 numbers.
To find the quantity sold when the price is a certain dollar, we can take the help of the line obtained by plotting 3 price point in the Y-axis to the corresponding quantity in the x-axis in the graph sheet, and join them to form a sloping straight line.
Once the new quantity is found for a particular price point from the above straight line, we can use this information to find the total revenue at that price.
(c)
To plot a graph and to measure the quantity on the horizontal axis and to determine the total revenue on the vertical axis.
Answer to Problem 1E
The graph is plotted and the quantity sold at 550$ is 1100 numbers.
Explanation of Solution
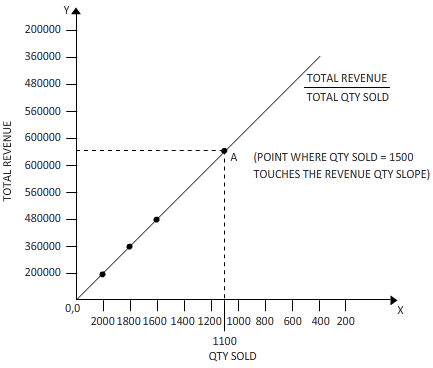
Now in the graph drawn above, the quantity sold is taken on X-axis while the total revenue obtained for that numbers of corresponding quantity sold is taken on Y-AXIS.
Next, we plot the points of total quantity sold on the horizontal X-axis versus the total Revenue obtained by selling each number of that quantity on the vertical Y-Axis. We take such thee points where the quantity-sold and corresponding revenue interacts, and join them to form a straight line.
To find the quantity sold when the price is at a certain dollar, we can take the help of the line obtained by plotting 3 price point in the Y-axis to the corresponding quantity in the x-axis in the graph sheet, and join them to form a sloping straight line.
Once the new quantity is found for a particular price point from the above straight line, we can use this information to find the total revenue at that price.
(d)
The total revenue when the price is $550 and to determine if the total revenue will increase or decrease when the price is lowered.
Answer to Problem 1E
When the quantity sold is $ 550, the total revenue is $ 6,40,000.
Explanation of Solution
We already know the quantity sold at each price point. Conversely, we know the price too when a particular number of items is sold. In this problem, the total revenue is to be found when the price is 550$. Now the corresponding total revenue to 1100 numbers is found to be 6,40,000 on the Y-axis. As we can see from the graph, decrease in price will increase the revenue.
To find the quantity sold when the price is a certain dollar, we can take the help of the line obtained by plotting 3 price point in the Y-axis to the corresponding quantity in the x-axis in the graph sheet, and join them to form a sloping straight line.
Once the new quantity is found for a particular price point from the above straight line, we can use this information to find the total revenue at that price.
Want to see more full solutions like this?
Chapter 1A Solutions
Microeconomics (MindTap Course List)

- PRICE (Dollars per bippitybop) 282 283 2 120 110 100 90 80 70 50 30 20 10 0 X8 05 10 15 20 25 30 35 40 QUANTITY (Bippitybops) Demand 45 50 55 60 Total Revenue On the following graph, use the green point (triangle symbol) to plot the annual total revenue when the market price is $20, $30, $40, $50, $60, $70, and $80 per bippitybop.arrow_forward1. Annual purchases of laptop computers in a certain market are 10 000 at a price of $3000, 20 000 at a price of $2000, and 30 000 at a price of $1000. a. Draw a graph showing this demand curve. Plot three points to draw the curve. b. Find sellers' total revenue at each price. c. On the basis of your answer to part b, is the market demand curve for laptop computers elastic or inelastic in the price range $3000 to $2000? in the price range $2000 to $1000? d. Calculate the numerical values of price elasticity of demand, e, in the two relevant price ranges using the formula found in the chapter. e. Are your answers to parts c and d for the two relevant price ranges consistent? 2. Calculate the appropriate elasticity coefficient in each of the following cases using the relevant formula outlined in the chapter. a. A drop in the price of hybrid cars from $25 000 to $20 000 causes purchases of gasoline-powered cars to fall from 1 million to 750 000 per year. b. Monthly purchases of…arrow_forwardWhat is total revenue if price and quantity and $5 and 20 unitsarrow_forward
- 60 50 40 30 20 10 0 TABLE 4-2 empt.php?attempt=112281&cmid=1144828page= falling. 600 700 800 900 1000 1100 1200 Refer to Table 4-2. Using the data provided to plot the demand curve for sk demand curve. Price elasticity along this demand curve is therefore Select one: O a. horizontal; constant at a value of 8 b. vertical; constant at a value of 0 c. downward sloping and linear continuously increasing d. rectangular hyperbola constant at a value of t e downward sloping and linear continuously decreasing Gatewayarrow_forwardHow are you going to increase your total revenue, if the demand of your product is inelastic? a. Increasing price b. Decreasing price c. changing price will not affect total revenue d. total revenue is increasing while the price changesarrow_forwardPrice $50 40 30 20 10- 0 50 100 150 200 250 300 350 400 450 500 Quantity Refer to Figure 5-6. What would lowering price from $30 to $20 do? It would increase total revenue by $2000. It would decrease total revenue by $2000. It would increase total revenue by $1000. It would decrease total revenue by $1000.arrow_forward
- Price (dollars) 8 7 D. 5 10 15 20 25 30 35 Quantity (units per year) In the figure above, when the price falls from $8 to $7, total revenue A) decreases from $210 to $120 so demand is inelastic. B) increases from $120 to $210 so demand is inelastic. C) decreases from $210 to $120 so demand is elastic. D) increases from $120 to $210 so demand is elastic. 6arrow_forwardQuestion 6 [A new drug called 'LowG', taken together with any food, reduces the glycemic index (a measure of the impact of the food on blood sugar) by 50%. Annual demand for this new medication can be described by the following table:] Quantity (millions of milligrams) 0 200 400 600 800 1000 1200 1400 1600 1800 2000 Price ($) 1000 900 800 700 600 500 400 300 200 100 0 a) [Rache, a pharmaceutical company, holds the patent on LowG and therefore is the only legal producer of the drug for the next 15 years. Calculate total revenue (TR) and marginal revenue (MR) for Rache at each price. Both Total Revenue (TR) and Marginal Revenue (MR) correctly calculated.arrow_forward6. Elasticity and total revenue The following graph shows the daily demand curve for bikes in Chicago. Use the green rectangle (triangle symbols) to compute total revenue at various prices along the demand curve. Note: You will not be graded on any changes made to this graph. 120 110 Total Revenue 100 90 80 70 60 40 A 30 20 10 Demand 16 24 32 40 48 56 64 72 80 88 96 QUANTITY (Bikes) PRICE (Dollars per bike) 50arrow_forward
- (1) The graph below shows the demand curves of two products by Ghana Nuts Company Ltd. Use the information provided on the graph to answer the questions that follow: Price Cedis per gallon 30 B 25 D1 D2 200 225 300 Quantity (gallons per day) (a) Calculate the price elasticity of demand for D, between point A and point C, and the price elasticity of demand for D2 between point A and point B. which of the two demand curve is more elastic? Briefly explain. (b) Suppose Ghana Nut is initially selling 200 gallons per day at a price of C30.00 per gallon, calculate the total revenue for Ghana Nuts Company Ltd. at price C30. If they cut the price to C25.00 per gallon and their demand curve is D1, what will be the change in their revenue? What will be the change in their revenue if demand curve is D2? 2. Suppose quantity demanded of beans increase from 1500 bags to 1800 bags as a result of an increase in the price of rice from GH¢80 to GH¢100. Calculate the cross price elasticity of demand for…arrow_forwardThe manager at Ruby Red Movie Theater decided to change the prices of concession stand items as well as tickets this month in an effort to increase revenues. Below, you are provided with prices for last month and this month as well as the quantities demanded for both months. Use this information when answering questions A-H, below. Price Quantity Demanded Item Last Month This Month Last Month This Month Large Drink $6.00 $5.50 150 161 Large Popcorn $7.50 $8.00 125 101 Small Drink $2.50 $2.00 75 80 Small Popcorn $5.00 $5.25 45 39 Candy $4.00 $3.50 57 68 Hot Dog $5.00 $5.25 35 36 Movie Tickets $8.00 $9.00 428 300 Calculate the price elasticity of demand for candy. (Show your work)arrow_forwardThe manager at Ruby Red Movie Theater decided to change the prices of concession stand items as well as tickets this month in an effort to increase revenues. Below, you are provided with prices for last month and this month as well as the quantities demanded for both months. Use this information when answering questions A-H, below. Price Quantity Demanded Item Last Month This Month Last Month This Month Large Drink $6.00 $5.50 150 161 Large Popcorn $7.50 $8.00 125 101 Small Drink $2.50 $2.00 75 80 Small Popcorn $5.00 $5.25 45 39 Candy $4.00 $3.50 57 68 Hot Dog $5.00 $5.25 35 36 Movie Tickets $8.00 $9.00 428 300 Calculate the price elasticity of demand for small drinks. (Show your work) Is the price elasticity of demand for small drinks price elastic, inelastic, or unit (unitary)? Briefly explain why in the box below…arrow_forward

 Economics Today and Tomorrow, Student EditionEconomicsISBN:9780078747663Author:McGraw-HillPublisher:Glencoe/McGraw-Hill School Pub Co