
ENGR.ECONOMIC ANALYSIS
14th Edition
ISBN: 9780190931919
Author: NEWNAN
Publisher: Oxford University Press
expand_more
expand_more
format_list_bulleted
Related questions
Question
thumb_up100%
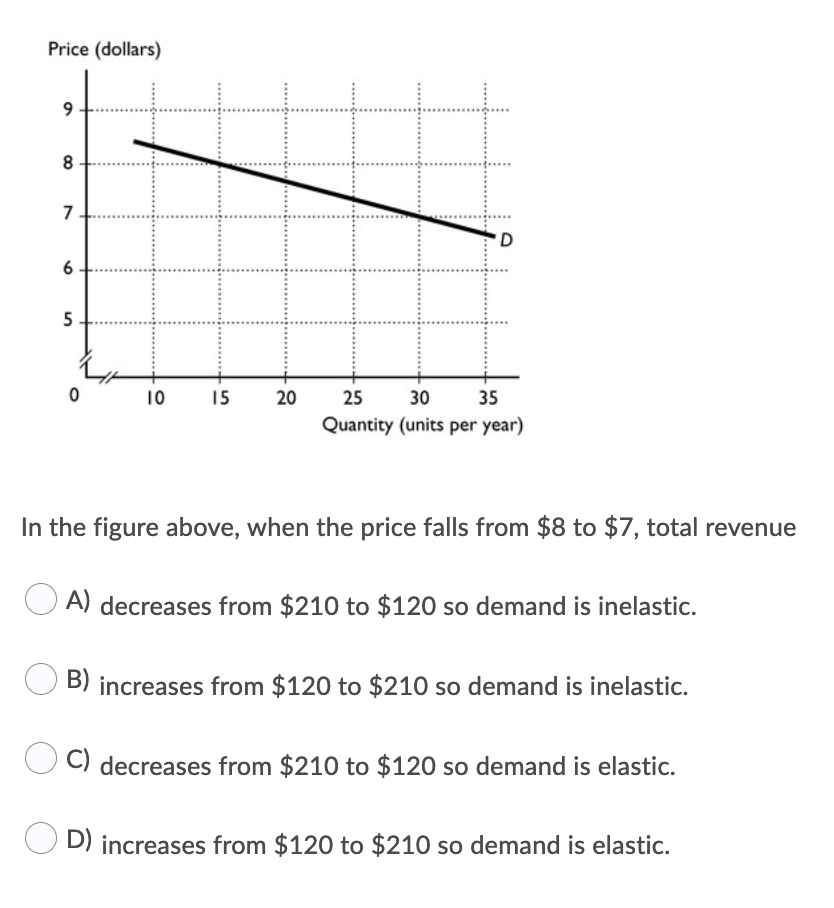

Transcribed Image Text:Price (dollars)
8
7
D.
5
10
15
20
25
30
35
Quantity (units per year)
In the figure above, when the price falls from $8 to $7, total revenue
A) decreases from $210 to $120 so demand is inelastic.
B) increases from $120 to $210 so demand is inelastic.
C) decreases from $210 to $120 so demand is elastic.
D) increases from $120 to $210 so demand is elastic.
6
Expert Solution
arrow_forward
Step 1: Introduction
You must track your overall revenue if you want to know how much money your company makes from all of the products and services it sells.
Total revenue indicates how much money your company makes before spending. And, because revenue is so important for growth, it's a measure that every business should keep track of.
We'll go over all you need to know about total income in this article.

Step by stepSolved in 2 steps

Knowledge Booster


Learn more about
Need a deep-dive on the concept behind this application? Look no further. Learn more about this topic, economics and related others by exploring similar questions and additional content below.Similar questions
- ect 19 6 Coffee Tuition Pizza Item Streaming TV Vacation (9) Quantity 20 pounds 1 year 150 pizzas 12 months 1 week Inflation Weighting Problem Unit Price $7 4,000 10 30 350 Total Budget Expenditure (Q X P) Item Weightarrow_forwardQuestion 21 The payoff matrix for two companies is seen below. The profits for Netflix are in the upper right hand corner, while the profits for Hulu are in the lower left hand corner. If Netflix raises their price, what is the best response by Hulu?arrow_forwardB C 1 2 D E Historical Price Data Seed Oil Mash Average Price Average Price Average Price 3 Marketing Year Index $/short ton Index $/short ton Index $/short ton 4 1 127.7 317.8 63 5 2 192.4 465 87 6 3 242 662.2 105 7 4 242 668.2 111 8 9 56 274 791.3 124 6 242 732 108 10 7 290 951 134 11 8 347.2 1123 153 12 9 436 1297.3 193 13 10 422.8 1312 187 14 11 466 1416 193 15 12 582 1664 247 16 13 508 1317.4 242 17 14 428 1182.4 197 18 15 434 1334.4 210arrow_forward
- San Francisco has rent control policies that limit the annual increase in rent by 2-3% (sometimes more when inflation is high) for existing tenants. What will happen if this limit is removed to the average rent, rental availability, rental quality. Who Benfits and does this increace ecominc effienccyarrow_forward23 ABC Electronics is a company that sells smartphones. If the Montly demand for a partcular smarthphon Model is 1000 units. The cost to place an order is Rioo, and the Carrying costs per unit per year is RS. The company Operates for 250 business Economic Order Quantity, CEOG 7 year. Caculate the Model. Calculate the EOQ. the Smarthphonearrow_forwardCalculate price per unit of table if total revenue is $6600 and the output sold is 30 unitsarrow_forward
- Total cost (dollars per unit) B 100- 80 - 60 40 3 4 Output (units per hour) 2. 20arrow_forwardBased on this graph,Calculate the total cost for 500 pairs of shoes.arrow_forwardQuestion: What is the extra cost imposed by the government which increase the price for a customer is known as?A SubsidyB TaxC InflationD FinePlease Dont use chatgpt or other ai tool. If you know correct answer then attempt if you gave wrong answer then i gave 30 dislikes for you and more from my friends accounts also.arrow_forward
- Consider the following data on a firm: Number of Units Sold Total Revenue (£'s) 10 20 30 40 50 60 70 100 180 240 280 300 300 280 Fixed Costs are £100, Variable costs are constant at £3 per (i) Write a table showing the price and quantity sold. (ii) Calculate the profit maximising output of the firm (iii) What are the profits at the profit maximising output? (v) unit produced. (iv) What is the average variable cost at the profit maximising output? What is the arc price elasticity of demand between 40 and 50 units?arrow_forwardPrice (dollars per gallon) $5.50 3.50 2.50 0 30 40 45 D S2 S₁ Quantity (millions of gallons per month)arrow_forward30- 25- 20- 15- 10- ç Price and cost (dollars per ride) -N 3 Quantity (rides per hour) -10 MCarrow_forward
arrow_back_ios
SEE MORE QUESTIONS
arrow_forward_ios
Recommended textbooks for you
 Principles of Economics (12th Edition)EconomicsISBN:9780134078779Author:Karl E. Case, Ray C. Fair, Sharon E. OsterPublisher:PEARSON
 Engineering Economy (17th Edition)EconomicsISBN:9780134870069Author:William G. Sullivan, Elin M. Wicks, C. Patrick KoellingPublisher:PEARSON
 Principles of Economics (MindTap Course List)EconomicsISBN:9781305585126Author:N. Gregory MankiwPublisher:Cengage Learning
 Managerial Economics: A Problem Solving ApproachEconomicsISBN:9781337106665Author:Luke M. Froeb, Brian T. McCann, Michael R. Ward, Mike ShorPublisher:Cengage Learning
 Managerial Economics & Business Strategy (Mcgraw-...EconomicsISBN:9781259290619Author:Michael Baye, Jeff PrincePublisher:McGraw-Hill Education
Principles of Economics (12th Edition)
Economics
ISBN:9780134078779
Author:Karl E. Case, Ray C. Fair, Sharon E. Oster
Publisher:PEARSON
Engineering Economy (17th Edition)
Economics
ISBN:9780134870069
Author:William G. Sullivan, Elin M. Wicks, C. Patrick Koelling
Publisher:PEARSON
Principles of Economics (MindTap Course List)
Economics
ISBN:9781305585126
Author:N. Gregory Mankiw
Publisher:Cengage Learning
Managerial Economics: A Problem Solving Approach
Economics
ISBN:9781337106665
Author:Luke M. Froeb, Brian T. McCann, Michael R. Ward, Mike Shor
Publisher:Cengage Learning
Managerial Economics & Business Strategy (Mcgraw-...
Economics
ISBN:9781259290619
Author:Michael Baye, Jeff Prince
Publisher:McGraw-Hill Education