Financial Accounting
14th Edition
ISBN: 9781305088436
Author: Carl Warren, Jim Reeve, Jonathan Duchac
Publisher: Cengage Learning
expand_more
expand_more
format_list_bulleted
Videos
Textbook Question
Chapter 17, Problem 1FSA
Financial Statement Analysis
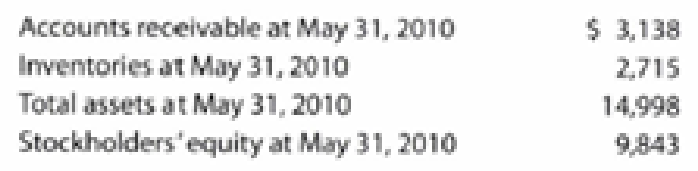
The financial statements for Nike, Inc., are presented in Appendix C at the end of the text. The following additional information (in thousands) is available:
Instructions
- 1. Determine the following measures for the fiscal years ended May 31, 2013 (fiscal 2012), and May 31, 2012 (fiscal 2011), rounding to one decimal place.
- a.
Working capital - b.
Current ratio - c. Quick ratio
- d. Accounts receivable turnover
- e. Number of days’ sales in receivables
- f. Inventory turnover
- g. Number of days’ sales in inventory
- h. Ratio of liabilities to stockholders’ equity
- i. Ratio of sales to assets
- j. Rate earned on total assets, assuming interest expense is $23 million for the year ending May 31, 2013, and $31 million for the year ending May 31, 2012
- k. Rate earned on common stockholders’ equity
- l. Price-earnings ratio, assuming that the market price was $61.66 per share on May 31, 2013, and $53.10 per share on May 31, 2012
- m. Percentage relationship of net income to sales
- a.
- 2. What conclusions can be drawn from these analyses?
Expert Solution & Answer

Trending nowThis is a popular solution!

Students have asked these similar questions
Access the February 21, 2017, filing of the December 31, 2016, 10-K report of The Hershey Company (ticker: HSY) at SEC.gov and complete the following requirements. Required Compute or identify the following profitability ratios of Hershey for its years ending December 31, 2016, and December 31, 2015. Interpret its profitability using the results obtained for these two years. 1. Profit margin ratio (round the percent to one decimal). 2. Gross profit ratio (round the percent to one decimal). 3. Return on total assets (round the percent to one decimal). (Total assets at year-end 2014 were $5,622,870 in thousands.) 4. Return on common stockholders’ equity (round the percent to one decimal). (Total shareholders’ equity at year-end 2014 was $1,519,530 in thousands.) 5. Basic net income per common share (round to the nearest cent).
FINANCIAL RATIO:
Requirement: Compute for the following financial ratios for the year 2021 (round-off answers to two decimal places)
a. Current ratio
b. Quick (Acid-test) ratio
c. Working capital
d. Inventory turnover
e. Days of inventory (use 365 days)
f. Accounts receivable turnover (assume all sales are on credit)
g. Days of receivable (use 365 days)
h. Debt ratio
i. Equity ratio
j. Debt-to-equity ratio
k. Gross profit ratio
1. Net profit ratio
m. Return on assets
n. Return on equity
FINANCIAL RATIO:
Requirement: Compute for the following financial ratios for the year 2021 (round-off answers to two decimal places)
f. Accounts receivable turnover (assume all sales are on credit)
g. Days of receivable (use 365 days)
h. Debt ratio
i. Equity ratio
j. Debt-to-equity ratio
k. Gross profit ratio
1. Net profit ratio
m. Return on assets
n. Return on equity
Chapter 17 Solutions
Financial Accounting
Ch. 17 - Prob. 1DQCh. 17 - What is the advantage of using comparative...Ch. 17 - Prob. 3DQCh. 17 - How would the current and quick ratios of a...Ch. 17 - Prob. 5DQCh. 17 - What do the following data, taken from a...Ch. 17 - a. How does the rate earned on total assets differ...Ch. 17 - Kroger, a grocery store, recently had a...Ch. 17 - Prob. 9DQCh. 17 - Prob. 10DQ
Ch. 17 - Prob. 1PEACh. 17 - Prob. 1PEBCh. 17 - Prob. 2PEACh. 17 - Vertical analysis Income statement information for...Ch. 17 - Prob. 3PEACh. 17 - Prob. 3PEBCh. 17 - Prob. 4PEACh. 17 - Prob. 4PEBCh. 17 - Prob. 5PEACh. 17 - Inventory analysis A company reports the...Ch. 17 - Prob. 6PEACh. 17 - Prob. 6PEBCh. 17 - Times interest earned A company reports the...Ch. 17 - Times interest earned A company reports the...Ch. 17 - Asset turnover A company reports the following:...Ch. 17 - Asset turnover A company reports the following:...Ch. 17 - Prob. 9PEACh. 17 - Prob. 9PEBCh. 17 - Common stockholders' profitability analysis A...Ch. 17 - Common stockholders' profitability analysis A...Ch. 17 - Earnings per share and price-earnings ratio A...Ch. 17 - Earnings per share and price-earnings ratio A...Ch. 17 - Revenue and expense data for Gresham Inc. for two...Ch. 17 - Prob. 2ECh. 17 - Common-sized income statement Revenue and expense...Ch. 17 - Prob. 4ECh. 17 - Prob. 5ECh. 17 - The following data were taken from the balance...Ch. 17 - Prob. 7ECh. 17 - The bond indenture for the 10-year, 9% debenture...Ch. 17 - The following data are taken from the financial...Ch. 17 - Prob. 10ECh. 17 - The following data were extracted from the income...Ch. 17 - Prob. 12ECh. 17 - Ratio of liabilities to stockholders equity and...Ch. 17 - Hasbro and Mattel, Inc., are the two largest toy...Ch. 17 - Ratio of liabilities to stockholders equity and...Ch. 17 - Three major segments of the transportation...Ch. 17 - Prob. 17ECh. 17 - Profitability ratios Ralph Lauren Corporation...Ch. 17 - The following data were taken from the financial...Ch. 17 - The balance sheet for Garcon Inc. at the end of...Ch. 17 - Earnings per share, price-earnings ratio, dividend...Ch. 17 - The table that follows shows the stock price,...Ch. 17 - Earnings per share, discontinued operations The...Ch. 17 - Prob. 24ECh. 17 - Prob. 25ECh. 17 - Unusual items Explain whether Colston Company...Ch. 17 - Prob. 1PACh. 17 - For 2016, Indigo Company initiated a sales...Ch. 17 - Effect of transactions on current position...Ch. 17 - The comparative financial statements of Bettancort...Ch. 17 - Addai Company has provided the following...Ch. 17 - Prob. 1PBCh. 17 - Prob. 2PBCh. 17 - Effect of transactions on current position...Ch. 17 - Prob. 4PBCh. 17 - Crosby Company has provided the following...Ch. 17 - Financial Statement Analysis The financial...Ch. 17 - Prob. 1CPCh. 17 - Prob. 2CPCh. 17 - The condensed income statements through income...Ch. 17 - Prob. 4CPCh. 17 - Marriott International, Inc., and Hyatt Hotels...
Knowledge Booster


Learn more about
Need a deep-dive on the concept behind this application? Look no further. Learn more about this topic, accounting and related others by exploring similar questions and additional content below.Similar questions
- Financial statement analysis The financial statements for Nike, Inc., are presented in Appendix D at the end of the text. Use the following additional information (in thousands): Instructions 1. Determine the following measures for the fiscal years ended May 31, 2016, and May 31, 2015. Round ratios and percentages to one decimal place. a. Working capital b. Current ratio c. Quick ratio d. Accounts receivable turnover e. Number of days sales in receivables f. Inventory turnover g. Number of days sales in inventory h. Ratio of liabilities to stockholders equity i. Asset turnover j. Return on total assets. k. Return on common stockholders equity l. Price-earnings ratio, assuming that the market price was 54.90 per share on May 29, 2016, and 52.81 per share on May 30, 2015 m. Percentage relationship of net income to sales 2. What conclusions can be drawn from these analyses?arrow_forwardReal-world annual report The financial statements for Nike, Inc. (NKE), are presented in Appendix E at the end of the text. The following additional information is available (in thousands): Instructions 1. Determine the following measures for the fiscal years ended May 31, 2017, and May 31, 2016. Round ratios and percentages to one decimal place. a. Working capital b. Current ratio c. Quick ratio d. Accounts receivable turnover e. Number of days sales in receivables f. Inventory turnover g. Number of days sales in inventory' h. Ratio of liabilities to stockholders equity i. Asset turnover j. Return on total assets, assuming interest expense is 82 million for the year ending May 31. 2017, and 33 million for the year ending May 31, 2016. k. k. Return on common stockholders equity l. Price-eamings ratio, assuming that the market price was 52.81 per share on May 31, 2017, and 54.35 per share on May 31, 2016. m. m. Percentage relationship of net income to sales 2. What conclusions can be drawn from these analyses?arrow_forwardJuroe Company provided the following income statement for last year: Juroes balance sheet as of December 31 last year showed total liabilities of 10,250,000, total equity of 6,150,000, and total assets of 16,400,000. Required: Note: Round answers to two decimal places. 1. Calculate the times-interest-earned ratio. 2. Calculate the debt ratio. 3. Calculate the debt-to-equity ratio.arrow_forward
- FINANCIAL RATIO: Requirement: Compute for the following financial ratios. for the year 2021 (round-off answers to two decimal places) d. Inventory turnover e. Days of inventory (use 365 days) f. Accounts receivable turnover (assume all sales are on credit) g. Days of receivable (use 365 days) h. Debt ratio i. Equity ratio j. Debt-to-equity ratioarrow_forwardThe condensed financial statements of Ivanhoe Company for the years 2020-2021 are presented below: (See Images) Compute the following financial ratios by placing the proper amounts for numerators and denominators. (Round per unit answers to 2 decimal places, e.g. 52.75.) (a) Current ratio at 12/31/21 $ $ (b) Acid test ratio at 12/31/21 $ $ (c) Accounts receivable turnover in 2021 $ $ (d) Inventory turnover in 2021 $ $ (e) Profit margin on sales in 2021 $ $ (f) Earnings per share in 2021 $ (g) Return on common stockholders’ equity in 2021 $ $ (h) Price earnings ratio at 12/31/21 $ $ (i) Debt to assets at 12/31/21 $ $ (j) Book value per share at 12/31/21 $arrow_forward1. Compute the following ratios for the comparative periods (2018 and 2019). The company used 365 days in its computation for some of the ratios. Show your solution. a. Working Capital b. Current Ratio c. Acid Test Ratio d. Accounts Receivable Turnover Ratio e. Average Collection Period f. Inventory Turnover Ratio g. Average Days in Inventory h. Number of days in Operating Cycle i. Debt to Total Assets Ratio j. Debt to Equity Ratio k. Times Interest Earned Ratio l. Gross Profit Ratio m. Profit Margin Ratio n. Return on Assets o. Return on Equity p. Assets Turnover Ratioarrow_forward
- 1. Compute the following ratios for the comparative periods (2018 and 2019). The company used 365 days in its computation for some of the ratios. Show your solution. d. Accounts Receivable Turnover Ratio e. Average Collection Period f. Inventory Turnover Ratio g. Average Days in Inventory h. Number of days in Operating Cycle i. Debt to Total Assets Ratio j. Debt to Equity Ratio k. Times Interest Earned Ratio l. Gross Profit Ratio m. Profit Margin Ratio n. Return on Assets o. Return on Equity p. Assets Turnover Ratioarrow_forwardUsing the fiscal year end 2020 annual report for General Mills, Inc. and the figures from the 2020 annual report as noted below, calculate the financial ratios for 2020 and 2019 indicated using the EXCEL template provided:1. Gross profit percentage2. Return on sales3. Asset turnover 4. Return on assets5. Return on common stockholders’ equity6. Current ratio7. Quick ratio8. Operating-cash-flow-to-current-liabilities ratio9. Accounts receivable turnoverTotal assets 2020 = $30,806.7Total stockholders’ equity 2020 = $8,349.5Total current liabilities 2020 = $7,491.5Accounts receivable 2020 = $1,615.1Inventory 2020 = $1,426.3Year-end closing stock price May 2020 = $58.80Year-end closing stock price May 2019 = $53.56 To calculate averages use (current year balance + poor year balance) / 2) Round percentages to 1 decimal place; round other answers to 2 decimal places.arrow_forwardSuppose the 2017 financial statements of 3M Company report net sales of $23.1 billion. Accounts receivable (net) are $3.40 billion at the beginning of the year and $3.54 billion at the end of the year. Compute 3M Company's receivable turnover. (Round answer to 1 decimal place, e.g. 12.5.) times Accounts receivable turnover ratio SHOW LIST OF ACCOUNTS LINK TO TEXT INTERACTIVE TUTORIAL Compute 3M Company's average collection period for accounts receivable in days. (Round answer to 1 decimal place, e.g. 12.5. Use 365 days for calculation.) Average collection period daysarrow_forward
- Instructions Using the financial statements and additional information, compute the following ratios for the El Camino Company for 2021. Show all computations. Computations 1. Current ratio 2. Return on common stockholders' equity 3. Price-earnings ratio 4. Inventory turnover 5. Accounts receivable turnover 6. Times interest earned 7. Profit margin 8. Days in inventory 9. Payout ratio 10. Return on assetsarrow_forwardA firm’s Balance Sheet and Income Statement for FY 2021 is displayed below and in the in the attached excel file. Answer the following questions. NOTE: For this question, use the end-of-the year approach (and not the mid-year convention). For example, this means that days receivables = end of FY receivables/daily sales; similarly for the remaining relevant ratios. You may use the tables below BALANCE SHEET 2021 Cash and cash equivalents 280 Receivables 2588 Inventory 2516 Other 189 TOTAL CA 5573 Fixed assets 5024 TOTAL ASSETS 10597 Accounts payable 4713 Short term debt 78 TOTAL CL 4790 LT debt 921 Shareh. Equity 4886 TOTAL LIAB. AND SHARH. EQUITY 10597 INCOME STATEMENT 2021 Sales 19418 COGS 13136 Depreciation 354 SG&A 4952 EBIT 976 Interest Expenses 52 Tax 268 Net income 656 Decompose the return on equity for the FY 2021…arrow_forwardA firm’s Balance Sheet and Income Statement for FY 2021 is displayed below and in the in the attached excel file. Answer the following questions. NOTE: For this question, use the end-of-the year approach (and not the mid-year convention). For example, this means that days receivables = end of FY receivables/daily sales; similarly for the remaining relevant ratios. You may use the tables below BALANCE SHEET 2021 Cash and cash equivalents 280 Receivables 2588 Inventory 2516 Other 189 TOTAL CA 5573 Fixed assets 5024 TOTAL ASSETS 10597 Accounts payable 4713 Short term debt 78 TOTAL CL 4790 LT debt 921 Shareh. Equity 4886 TOTAL LIAB. AND SHARH. EQUITY 10597 INCOME STATEMENT 2021 Sales 19418 COGS 13136 Depreciation 354 SG&A 4952 EBIT 976 Interest Expenses 52 Tax 268 Net income 656 Determine the NLF, NSF and the liquidity ratio…arrow_forward
arrow_back_ios
SEE MORE QUESTIONS
arrow_forward_ios
Recommended textbooks for you
 Financial AccountingAccountingISBN:9781305088436Author:Carl Warren, Jim Reeve, Jonathan DuchacPublisher:Cengage Learning
 Financial And Managerial AccountingAccountingISBN:9781337902663Author:WARREN, Carl S.Publisher:Cengage Learning,
 Managerial AccountingAccountingISBN:9781337912020Author:Carl Warren, Ph.d. Cma William B. TaylerPublisher:South-Western College Pub
 Financial AccountingAccountingISBN:9781337272124Author:Carl Warren, James M. Reeve, Jonathan DuchacPublisher:Cengage Learning
 Managerial Accounting: The Cornerstone of Busines...AccountingISBN:9781337115773Author:Maryanne M. Mowen, Don R. Hansen, Dan L. HeitgerPublisher:Cengage Learning
 Financial Accounting: The Impact on Decision Make...AccountingISBN:9781305654174Author:Gary A. Porter, Curtis L. NortonPublisher:Cengage Learning
Financial Accounting
Accounting
ISBN:9781305088436
Author:Carl Warren, Jim Reeve, Jonathan Duchac
Publisher:Cengage Learning
Financial And Managerial Accounting
Accounting
ISBN:9781337902663
Author:WARREN, Carl S.
Publisher:Cengage Learning,
Managerial Accounting
Accounting
ISBN:9781337912020
Author:Carl Warren, Ph.d. Cma William B. Tayler
Publisher:South-Western College Pub
Financial Accounting
Accounting
ISBN:9781337272124
Author:Carl Warren, James M. Reeve, Jonathan Duchac
Publisher:Cengage Learning
Managerial Accounting: The Cornerstone of Busines...
Accounting
ISBN:9781337115773
Author:Maryanne M. Mowen, Don R. Hansen, Dan L. Heitger
Publisher:Cengage Learning
Financial Accounting: The Impact on Decision Make...
Accounting
ISBN:9781305654174
Author:Gary A. Porter, Curtis L. Norton
Publisher:Cengage Learning
Financial ratio analysis; Author: The Finance Storyteller;https://www.youtube.com/watch?v=MTq7HuvoGck;License: Standard Youtube License