
Videos
Interpretation:
The graph that represents the reaction between nitrogen and hydrogen gas to produce ammonia have to be explained.
Concept Introduction:
Explanation of Solution
The given chemical equation is-
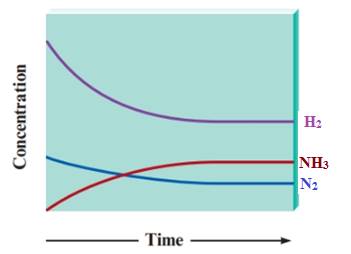
Initially the concentration of the product NH3is zero. The concentration of NH3gradually increases with time and the concentration of H2 and N2gradually decrease with time. The rate of decrease in the concentration of H2 is higher than concentration of N2as more number of H2 molecules are consumed in the course of the reaction. After a certain time, the concentrations of reactants and products are no longer changing. That means the reaction is in equilibrium. All concentrations become constant asthe horizontal lines in the graphremain constant.
Chapter 17 Solutions
World of Chemistry, 3rd edition


 ChemistryChemistryISBN:9781305957404Author:Steven S. Zumdahl, Susan A. Zumdahl, Donald J. DeCostePublisher:Cengage Learning
 ChemistryChemistryISBN:9781259911156Author:Raymond Chang Dr., Jason Overby ProfessorPublisher:McGraw-Hill Education
 Principles of Instrumental AnalysisChemistryISBN:9781305577213Author:Douglas A. Skoog, F. James Holler, Stanley R. CrouchPublisher:Cengage Learning
 Organic ChemistryChemistryISBN:9780078021558Author:Janice Gorzynski Smith Dr.Publisher:McGraw-Hill Education
 Chemistry: Principles and ReactionsChemistryISBN:9781305079373Author:William L. Masterton, Cecile N. HurleyPublisher:Cengage Learning
 Elementary Principles of Chemical Processes, Bind...ChemistryISBN:9781118431221Author:Richard M. Felder, Ronald W. Rousseau, Lisa G. BullardPublisher:WILEY