Concept explainers
Videos
To plot the resulting function of given discrete-time dynamical system and use this function to plot the concentration after 10 days.
Answer to Problem 50E
It is observed from the concentration values, that the concentration reaches the value 2 after 10 days.
Explanation of Solution
Given:
The discrete-time dynamical system :
Consider the following discrete-time dynamical system representing the medication
Let us find the concentration of medication after 10 days by following the above system 10 times
Let the initial concentration be
Therefore, the concentration after 1 day is as follows
The concentration after 2 days is as follows
The concentration after 3 days is as follows
Observing the pattern of concentration on first 3 days represented by equation (1), equation (2) and equation (3), the concentration on 10th day is as follows
Graph of the function is shown below
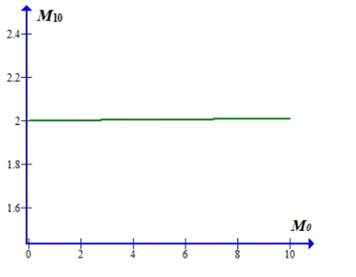
Let us find the concentration after 10 days if the starting concentration is 1.0
Let us find the concentration after 10 days if the starting concentration is 5.0
Let us find the concentration after 10 days if the starting concentration is 18.0
It is observed from the concentration values, that the concentration reaches the value 2 after 10 days.
Thus, to achieve the goal of stable concentration of 2.0 miligrams per liter, this therapy is good.
Want to see more full solutions like this?
Chapter 1 Solutions
Modeling the Dynamics of Life: Calculus and Probability for Life Scientists


- For the following exercise, choose the correct answer choice. A doctor and injects a patient with 13 milligrams of radioactive dye that decays exponentially. After 12 minutes, there are 4.75 milligrams of dye remaining in the patient’s system. Which is an appropriate model for this situation? a. f(t)=13(0.0805)t b. f(t)=13e0.9195t c. f(t)=13e(0.0839t) d. f(t)=4.751+13e0.83925tarrow_forwardThe table shows the mid-year populations (in millions) of five countries in 2015 and the projected populations (in millions) for the year 2025. (a) Find the exponential growth or decay model y=aebt or y=aebt for the population of each country by letting t=15 correspond to 2015. Use the model to predict the population of each country in 2035. (b) You can see that the populations of the United States and the United Kingdom are growing at different rates. What constant in the equation y=aebt gives the growth rate? Discuss the relationship between the different growth rates and the magnitude of the constant.arrow_forwardFor the following exercise, consider this scenario: In 2004, a school population was 1,700. By 2012 the population had grown to 2,500. Assume the population is changing linearly. a. How much did the population grow between the year 2004 and 2012? b. What is the average population growth per year? c. Find an equation for the population, P, of the school t years after 2004.arrow_forward
 Calculus For The Life SciencesCalculusISBN:9780321964038Author:GREENWELL, Raymond N., RITCHEY, Nathan P., Lial, Margaret L.Publisher:Pearson Addison Wesley,

 Algebra & Trigonometry with Analytic GeometryAlgebraISBN:9781133382119Author:SwokowskiPublisher:Cengage
 Glencoe Algebra 1, Student Edition, 9780079039897...AlgebraISBN:9780079039897Author:CarterPublisher:McGraw Hill