Videos
(a)
To find: The graph for the given condition.
(a)
Explanation of Solution
Given:
The equation is,
Calculation:
Let initial be
The population for first generation is,
The population for second generation is,
The population for third generation is,
The population for tenth generation is,
Now,
Plot the graph,
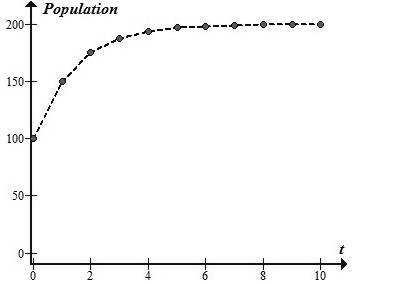
Figure 1
Thus, the graph for the given condition is shown in figure 1.
(b)
To find: The graph for the given condition.
(b)
Explanation of Solution
Given:
The equation is,
Calculation:
Let initial be
The population for first generation is,
The population for second generation is,
The population for third generation is,
The population for tenth generation is,
Now,
Plot the graph,
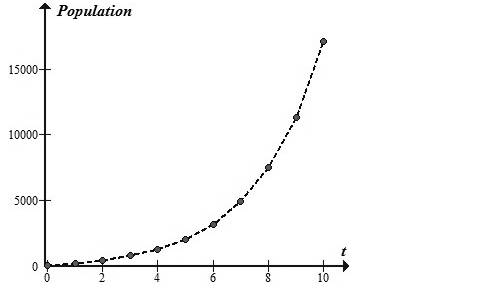
Figure 2
Thus, the graph for the given condition is shown in figure 2.
(c)
To find: The graph for the given condition.
(c)
Explanation of Solution
Given:
The equation is,
Calculation:
Let initial be
The population for first generation is,
The population for second generation is,
The population for third generation is,
The population for tenth generation is,
Now,
Plot the graph,
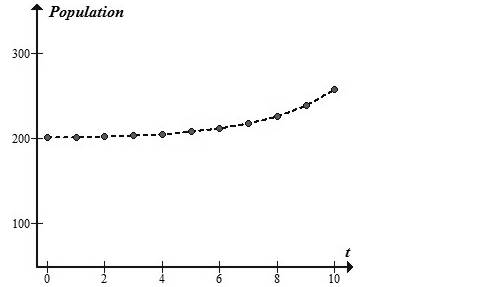
Figure 3
Thus, the graph for the given condition is shown in figure 3.
(d)
To find: The graph for the given condition.
(d)
Answer to Problem 49E
The graph for the given condition is shown in figure 4.
Explanation of Solution
Given:
The equation is,
Calculation:
Let initial be
The population for first generation is,
The population for second generation is,
The population for third generation is,
The population for tenth generation is,
Now,
Plot the graph,
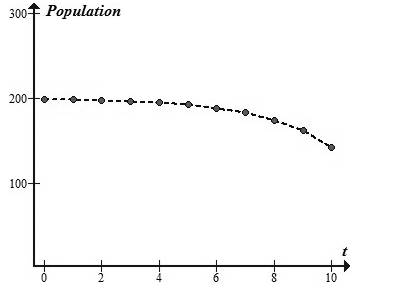
Figure 4
Thus, the graph for the given condition is shown in figure 4.
(e)
To find: The model when run for 15 steps.
(e)
Answer to Problem 49E
After fifteen steps, the value becomes negative.
Explanation of Solution
Given:
The equation is,
Calculation:
The population for fifteenth generation is,
Now,
Thus, after fifteen steps, the value becomes negative.
Want to see more full solutions like this?
Chapter 1 Solutions
Modeling the Dynamics of Life: Calculus and Probability for Life Scientists


- 23. Consider a simple economy with just two industries: farming and manufacturing. Farming consumes 1/2 of the food and 1/3 of the manufactured goods. Manufacturing consumes 1/2 of the food and 2/3 of the manufactured goods. Assuming the economy is closed and in equilibrium, find the relative outputs of the farming and manufacturing industries.arrow_forwardWhat is a system of linear equations in the variables x, y, and z?arrow_forward
 Linear Algebra: A Modern IntroductionAlgebraISBN:9781285463247Author:David PoolePublisher:Cengage Learning
 Glencoe Algebra 1, Student Edition, 9780079039897...AlgebraISBN:9780079039897Author:CarterPublisher:McGraw Hill
 College Algebra (MindTap Course List)AlgebraISBN:9781305652231Author:R. David Gustafson, Jeff HughesPublisher:Cengage Learning
 Elementary Linear Algebra (MindTap Course List)AlgebraISBN:9781305658004Author:Ron LarsonPublisher:Cengage Learning
 College AlgebraAlgebraISBN:9781305115545Author:James Stewart, Lothar Redlin, Saleem WatsonPublisher:Cengage Learning
 Algebra and Trigonometry (MindTap Course List)AlgebraISBN:9781305071742Author:James Stewart, Lothar Redlin, Saleem WatsonPublisher:Cengage Learning