
Concept explainers
Videos
(a)
To Explain: the amount of cereal left in the box expected.
(a)
Answer to Problem 39E
12.2
Explanation of Solution
Given:
Suppose X is the quantity of cereal that could be poured in a little pan
Suppose that Y is the quantity of cereal in a large bowl.
| Mean | SD | |
| X | 1.5 | 0.3 |
| Y | 2.5 | 0.4 |
Formula used:
Calculation:
Expected value is
The mean cereal in the box is 12.2
(b)
To find: the standard deviation.
(b)
Answer to Problem 39E
0.51
Explanation of Solution
Given:
Suppose X is the quantity of cereal that could be poured in a little pan
Suppose that Y is the quantity of cereal in a large bowl.
| Mean | SD | |
| X | 1.5 | 0.3 |
| Y | 2.5 | 0.4 |
Formula used:
Calculation:
We first find the variance
Standard deviation is 0.15 Ounce.
(c)
To find: this box is more than 13 ounces possibly.
(c)
Answer to Problem 39E
5.8%
Explanation of Solution
Given:
Suppose X is the quantity of cereal that could be poured in a little pan
Suppose that Y is the quantity of cereal in a large bowl.
| Mean | SD | |
| X | 1.5 | 0.3 |
| Y | 2.5 | 0.4 |
Calculation:
A normal model with mean 12.2 and standard deviation 0.51 is the left-over number L.
Required probability that greater than 13 ounces are
The following graph gives the area of the probability
Graph:
The below graph mentions the area of the probability
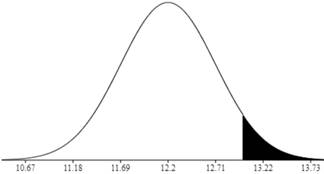
Therefore, there is 5.8% possibility that box still is having greater than 13 ounces of cereal.
Chapter 16 Solutions
Stats: Modeling the World Nasta Edition Grades 9-12
Additional Math Textbook Solutions
Statistics for Psychology
STATS:DATA+MODELS-W/DVD
Basic Business Statistics, Student Value Edition (13th Edition)
Introductory Statistics (10th Edition)
Fundamentals of Statistics (5th Edition)
Basic Business Statistics, Student Value Edition


 MATLAB: An Introduction with ApplicationsStatisticsISBN:9781119256830Author:Amos GilatPublisher:John Wiley & Sons Inc
 Probability and Statistics for Engineering and th...StatisticsISBN:9781305251809Author:Jay L. DevorePublisher:Cengage Learning
 Statistics for The Behavioral Sciences (MindTap C...StatisticsISBN:9781305504912Author:Frederick J Gravetter, Larry B. WallnauPublisher:Cengage Learning
 Elementary Statistics: Picturing the World (7th E...StatisticsISBN:9780134683416Author:Ron Larson, Betsy FarberPublisher:PEARSON
 The Basic Practice of StatisticsStatisticsISBN:9781319042578Author:David S. Moore, William I. Notz, Michael A. FlignerPublisher:W. H. Freeman
 Introduction to the Practice of StatisticsStatisticsISBN:9781319013387Author:David S. Moore, George P. McCabe, Bruce A. CraigPublisher:W. H. Freeman