
Videos
(a)
To find: The
(a)
Answer to Problem 41E
Mean = 200.57
Standard Deviation = 0.461
Explanation of Solution
Given:
| Swimmer | Mean | SD |
| 1 (backstroke) | 50.72 | 0.24 |
| 2 (breaststroke) | 55.51 | 0.22 |
| 3 (butterfly) | 49.43 | 0.25 |
| 4 (freestyle) | 44.91 | 0.21 |
Suppose
B = Back Stroke Time Swimmer
R = breast stroke time swimmer
F = butterfly stroke time swimmer
S = free style time swimmer
Formula used:
Calculation:
T be the time swimmer did all 4 strokes
Therefore, the mean and standard deviation is mention by 200.57 and 0.461 respectively.
(b)
To Explain: that at the conference championship the team is expected to swim better than that.
(b)
Answer to Problem 41E
0.991
Explanation of Solution
Given:
| Swimmer | Mean | SD |
| 1 (backstroke) | 50.72 | 0.24 |
| 2 (breaststroke) | 55.51 | 0.22 |
| 3 (butterfly) | 49.43 | 0.25 |
| 4 (freestyle) | 44.91 | 0.21 |
Suppose
B = Back Stroke Time Swimmer
R = breast stroke time swimmer
F = butterfly stroke time swimmer
S = free style time swimmer
Calculation:
probability that researcher can swim faster is mentioned by
Graph:
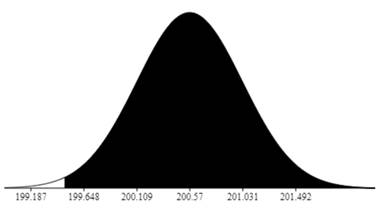
Required probability to run faster is 0.991
Chapter 16 Solutions
Stats: Modeling the World Nasta Edition Grades 9-12
Additional Math Textbook Solutions
Elementary Statistics: Picturing the World (6th Edition)
Basic Business Statistics, Student Value Edition (13th Edition)
Intro Stats
STATS:DATA+MODELS-W/DVD
Basic Business Statistics, Student Value Edition
Introductory Statistics (10th Edition)


 MATLAB: An Introduction with ApplicationsStatisticsISBN:9781119256830Author:Amos GilatPublisher:John Wiley & Sons Inc
 Probability and Statistics for Engineering and th...StatisticsISBN:9781305251809Author:Jay L. DevorePublisher:Cengage Learning
 Statistics for The Behavioral Sciences (MindTap C...StatisticsISBN:9781305504912Author:Frederick J Gravetter, Larry B. WallnauPublisher:Cengage Learning
 Elementary Statistics: Picturing the World (7th E...StatisticsISBN:9780134683416Author:Ron Larson, Betsy FarberPublisher:PEARSON
 The Basic Practice of StatisticsStatisticsISBN:9781319042578Author:David S. Moore, William I. Notz, Michael A. FlignerPublisher:W. H. Freeman
 Introduction to the Practice of StatisticsStatisticsISBN:9781319013387Author:David S. Moore, George P. McCabe, Bruce A. CraigPublisher:W. H. Freeman