Concept explainers
Videos
Interpretation:
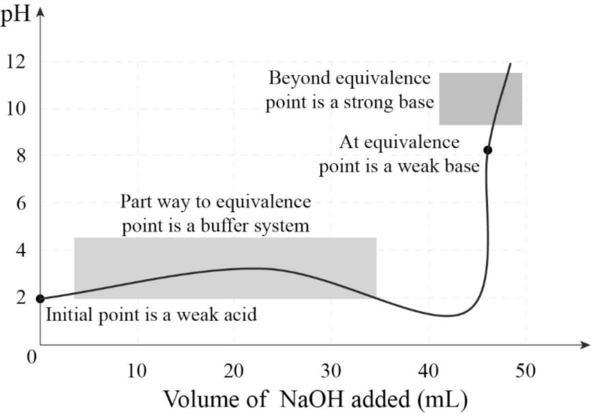
The titration curve has to be drawn and four regions of importance from the given information has to be labeled.
Explanation of Solution
The volume of base required to reach the equivalence point can be calculated as given below.
The addition of
Addition of
The iCe table can be set up to calculate the
The
This can be solved by approximation. If
The
Addition of
The neutralization reaction can be written as given,
Calculation of milimoles of acid and base:
Making of sRfc table:
The table can be formed as shown below.
The molar ratio of acid and base is
The entire strong base is consumed. There are weak acid
Addition of
Calculation of milimoles of acid and base:
Making of sRfc table:
The table can be formed as shown below.
The molar ratio of acid and base is
The entire strong base is consumed. There are weak acid
Addition of
Calculation of milimoles of acid and base and total volume:
Making of sRfc table:
The table can be formed as shown below.
The molar ratio of acid and base is
Both
The iCe table can be set up to calculate the
The expression for
The value of
This can be solved by approximation. If
The
Addition of
Calculation of milimoles of acid and base and total volume:
Making of sRfc table:
The table can be formed as shown below.
The molar ratio of acid and base is
Now, the
Titration curve:
The titration curve is plotted between volume of base added and the corresponding
The titration curve with four important regions is given below.
Figure
Want to see more full solutions like this?
Chapter 16 Solutions
Chemistry: Principles and Practice


- The titration curves for two acids with the same base are shown on this graph. (a) Which is the curve for the weaker acid? Explain your choice. (b) Give the approximate pH at the equivalence point for the titration of each acid. (c) Explain why the pH at the equivalence point differs for each acid. (d) Explain why the starting pH values of the two acids differ. (e) Which indicator or indicators, phenolphthalein, bromthymol blue, or methyl red, could be used for the titration of Acid 1? For the titration of Acid 2? Explain your choices.arrow_forwardFor the titration of 50.0 mL of 0.100-M HCl with 0.100-M NaOH, calculate the pH when these volumes of NaOH have been added: (a) 10.0 mL (b) 25.00 mL (c) 45.0 mL (d) 50.5 mLarrow_forwardCalculate the pH during the titration of 50.00 mL of 0.100 M Sr(OH)2 with 0.100 M HNO3 after 0, 50.00, 100.00, and 150.00 mL nitric acid have been added. Graph the titration curve and compare with the titration curve obtained in Exercise 16.22.arrow_forward
- Calculate the pH change when 10.0 mL of 0.100-M NaOH is added to 90.0 mL pure water, and compare the pH change with that when the same amount of NaOH solution is added to 90.0 mL of a buffer consisting of 1.00-M NH3 and 1.00-M NH4Cl. Assume that the volumes are additive. Kb of NH3 = 1.8 × 10-5.arrow_forwardRepeat the procedure in Exercise 61, but for the titration of 25.0 mL of 0.100 M pyridine with 0.100 M hydrochloric acid (Kb for pyridine is 1.7 109). Do not calculate the points at 24.9 and 25.1 mL.arrow_forward
 Chemistry: Principles and PracticeChemistryISBN:9780534420123Author:Daniel L. Reger, Scott R. Goode, David W. Ball, Edward MercerPublisher:Cengage Learning
 Chemistry: The Molecular ScienceChemistryISBN:9781285199047Author:John W. Moore, Conrad L. StanitskiPublisher:Cengage Learning
 Chemistry & Chemical ReactivityChemistryISBN:9781337399074Author:John C. Kotz, Paul M. Treichel, John Townsend, David TreichelPublisher:Cengage Learning
 Chemistry & Chemical ReactivityChemistryISBN:9781133949640Author:John C. Kotz, Paul M. Treichel, John Townsend, David TreichelPublisher:Cengage Learning