
Introduction To Statistics And Data Analysis
6th Edition
ISBN: 9781337793612
Author: PECK, Roxy.
Publisher: Cengage Learning,
expand_more
expand_more
format_list_bulleted
Concept explainers
Videos
Textbook Question
Chapter 15.2, Problem 20E
The accompanying data resulted from a flammability study in which specimens of five different fabrics were tested to determine burn times.
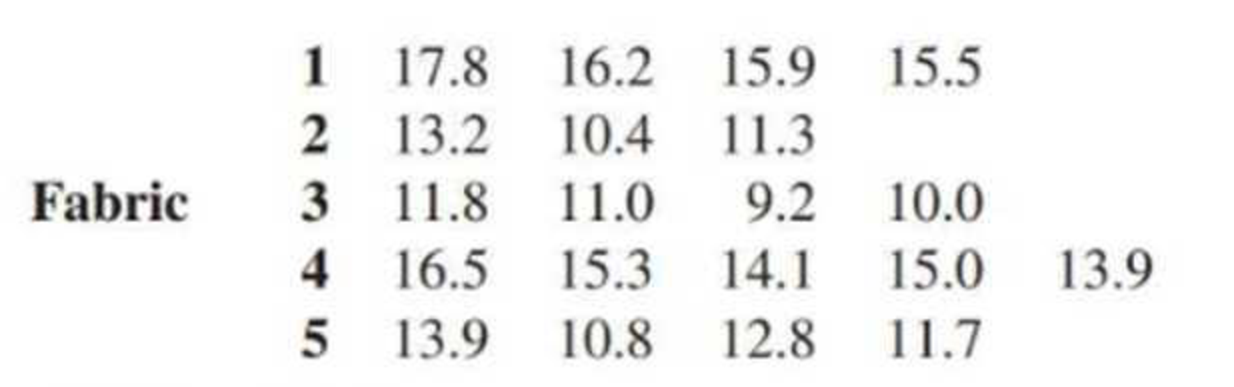
MSTr = 23.67
MSE = 1.39
F = 17.08
P-value = 0.000
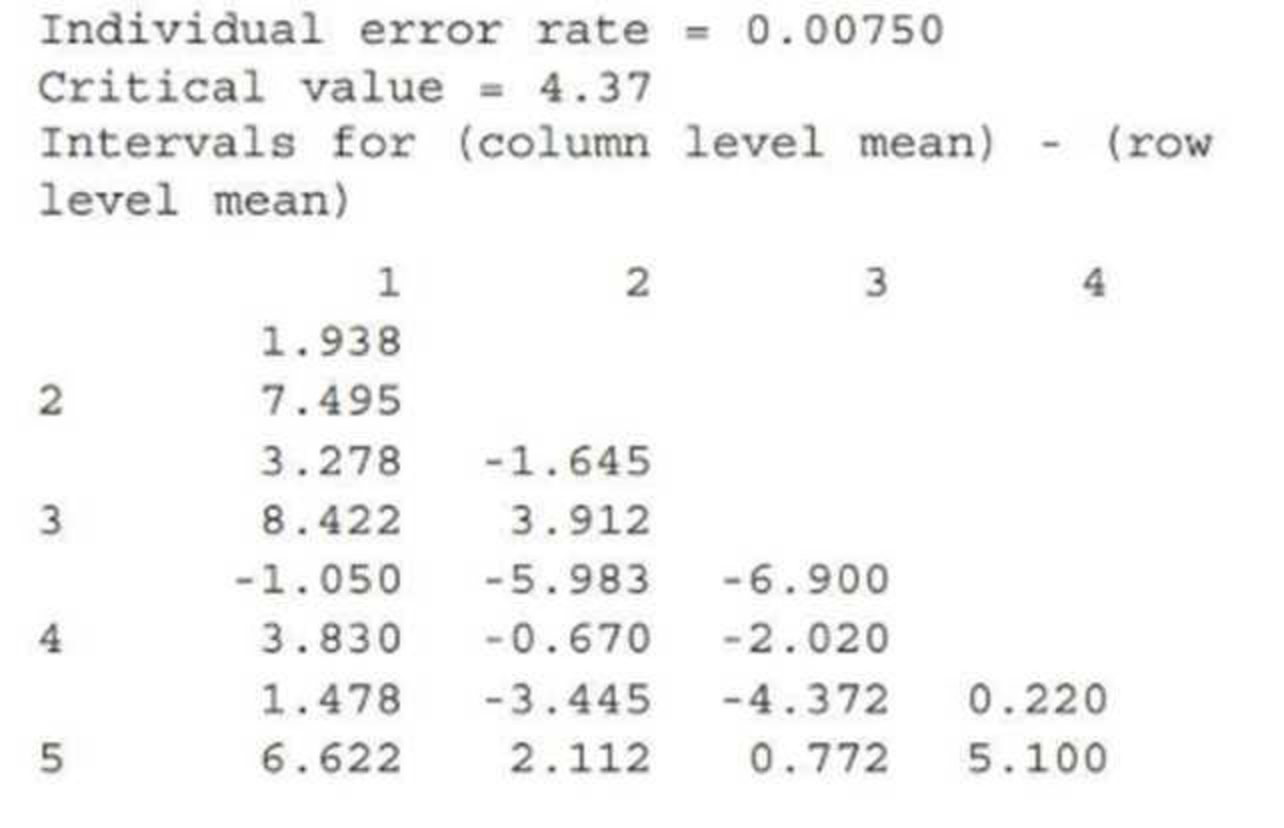
The accompanying output gives the T-K intervals as calculated by Minitab. Identify significant differences and give the underscoring pattern.
Expert Solution & Answer

Trending nowThis is a popular solution!

Students have asked these similar questions
What does MS between reflects?
A researcher collects data that represents the average number of hours of sleep in the last two nights by 8 depressed patients and 9 non-depressed patients. The researcher is interested in whether the two groups reliably differ in the amount of sleep they get.
Use Jamovi to calculate t-obt and the p value.
aChen -. M Gmail
YouTube
Maps
oscar - Google D...
Translate
New Tab
ece Gler
2/6
100%
SID:
2. A researcher is studying the relationship between various properties of wine and
their taste characteristics. The histogram below shows the amount of residual sugar
(sugar left after fermentation) in a collection of wines. However, one of the bars,
between 3 and 5 grams per liter, is missing.
50
(47.9)
(38.7)
30
10
(0.1)
(0.92)
(0.1)
2
10
15
Residual sugar (grams/liter)
Calculate the height of the missing bar and draw it in. (Show your work below, and
indicate the numerical value in parentheses above the bar.)
% per gramlter
Chapter 15 Solutions
Introduction To Statistics And Data Analysis
Ch. 15.1 - Give as much information as you can about the...Ch. 15.1 - Prob. 2ECh. 15.1 - Employees of a state university system can choose...Ch. 15.1 - The accompanying summary statistics for a measure...Ch. 15.1 - The authors of the paper Age and Violent Content...Ch. 15.1 - The paper referenced in the previous exercise also...Ch. 15.1 - Do people feel hungrier after sampling a healthy...Ch. 15.1 - Prob. 8ECh. 15.1 - The Paper Womens and Mens Eating Behavior...Ch. 15.1 - Can use of an online plagiarism-detection system...
Ch. 15.1 - Prob. 11ECh. 15.1 - In the introduction to this chapter, we considered...Ch. 15.1 - In an experiment to investigate the performance of...Ch. 15.2 - Leaf surface area is an important variable in...Ch. 15.2 - Prob. 15ECh. 15.2 - Prob. 16ECh. 15.2 - Prob. 17ECh. 15.2 - The paper referenced in Exercise 15.5 described an...Ch. 15.2 - Prob. 19ECh. 15.2 - The accompanying data resulted from a flammability...Ch. 15.2 - Do lizards play a role in spreading plant seeds?...Ch. 15.2 - Samples of six different brands of diet or...Ch. 15.3 - A particular county employs three assessors who...Ch. 15.3 - The accompanying display is a partially completed...Ch. 15.3 - With the use of biofuels increasing, investigators...Ch. 15.3 - Prob. 26ECh. 15.3 - Prob. 27ECh. 15.3 - Prob. 28ECh. 15.4 - Prob. 29ECh. 15.4 - The paper Feedback Enhances the Positive Effects...Ch. 15.4 - The following graphs appear in the paper Which...Ch. 15.4 - The behavior of undergraduate students when...Ch. 15.4 - Prob. 33ECh. 15.4 - The following partially completed ANOVA table...Ch. 15.4 - Prob. 35ECh. 15.4 - The accompanying ANOVA table is similar to one...Ch. 15.4 - Identification of sex in human skeletons is an...Ch. 15 - Suppose that a random sample or size n = 5 was...Ch. 15 - Parents are frequently concerned when their child...Ch. 15 - Prob. 40CRCh. 15 - Consider the accompanying data on plant growth...Ch. 15 - Prob. 42CRCh. 15 - Prob. 43CRCh. 15 - Prob. 44CRCh. 15 - Prob. 45CRCh. 15 - Prob. 46CRCh. 15 - Prob. 47CRCh. 15 - Prob. 48CRCh. 15 - Prob. 49CR
Knowledge Booster


Learn more about
Need a deep-dive on the concept behind this application? Look no further. Learn more about this topic, statistics and related others by exploring similar questions and additional content below.Similar questions
- Find the linear correlation coefficient for stride length versus speed of an adult man inTable 12.8a. Round your result to the nearest hundredth.arrow_forwardInterpret effect size t(90)=4.06, p=.001, n2= .11 Small, medium, or largearrow_forwardA river was contaminated with waste materials. Specimens of these materials were collected andtheir physical appearance recorded as shown in Table 3. Is there evidence of association betweencolor and texture for these waste materials based on the given hypothesis? Explain your findings.Use ? = 0.05.H0: No relationship between texture and colourH1: Relationship exist between texture and colour colour colour colour texture light medium dark fine 4 20 8 medium 5 23 12 coarse 21 23 4arrow_forward
- Using the LSRL, y hat = -25.5+1.5x, what is the residual for the data point at (28,19)arrow_forwardFind the z-scores for which 90% of the distribution's area lies between -z and z. Please show how the answer can be found using a TI-84 calculator. Thank you.arrow_forwardGlaucoma is a leading cause of blindness in the United States, N. Ehlers measured the difference in corneal thickness (in microns) between the two eyes of eight patients. Each patient had one eye that had glaucoma and one eye that was normal. The difference was measured as the corneal thickness of normal eye – corneal thickness of eye with Glaucoma. Corneal thickness is important because it can mask an accurate reading of eye pressure. Use ? = .05. Q) If a participant has the same corneal thickness in their normal eye as the eye with Glaucoma, what would be the value for difference: measured as the corneal thickness of normal eye – corneal thickness of eye with Glaucoma.arrow_forward
- Glaucoma is a leading cause of blindness in the United States, N. Ehlers measured the difference in corneal thickness (in microns) between the two eyes of eight patients. Each patient had one eye that had glaucoma and one eye that was normal. The difference was measured as the corneal thickness of normal eye – corneal thickness of eye with Glaucoma. Corneal thickness is important because it can mask an accurate reading of eye pressure. Use ? = .05. Hypothesis: H0: μd=0Ha: μd≠0 Using output Test statistics : t=0.134P value=0.897 Degrees of freedom (df): df=7 Level of significance: α=0.05 Decision: P value > 0.05 thus we fails to reject null hypothesis. Question a)Write a report summarizing your findings. When writing the report consider that medical staff estimate that a difference of 4.5 microns or more could impact on their ability to interpret eye pressure correctly. b) Define for the hypothesis stated in part b) what a type 1 error and type 2 error would mean. Is it possible…arrow_forwardGlaucoma is a leading cause of blindness in the United States, N. Ehlers measured the difference in corneal thickness (in microns) between the two eyes of eight patients. Each patient had one eye that had glaucoma and one eye that was normal. The difference was measured as the corneal thickness of normal eye – corneal thickness of eye with Glaucoma. Corneal thickness is important because it can mask an accurate reading of eye pressure. Use ? = .05 H0: μd=0 H1: μd≠0 T statistic: t = 1.053, P value = 0.327 Degrees of Freedom n-1 = 8-1= 7 critical value 2.3646 If t is less than 2.3646, or greater than 2.3646, reject the null hypothesis Level of significance: α=0.05 question: what a type 1 error and type 2 error would mean. Is it possible that we could have committed a type 2 error in conducting the testarrow_forwardGlaucoma is a leading cause of blindness in the United States, N. Ehlers measured the difference in corneal thickness (in microns) between the two eyes of eight patients. Each patient had one eye that had glaucoma and one eye that was normal. The difference was measured as the corneal thickness of normal eye – corneal thickness of eye with Glaucoma. Corneal thickness is important because it can mask an accurate reading of eye pressure. Use ? = .05. If a participant has the same corneal thickness in their normal eye as the eye with Glaucoma, what would be the value for difference: measured as the corneal thickness of normal eye – corneal thickness of eye with Glaucoma.arrow_forward
- Glaucoma is a leading cause of blindness in the United States, N. Ehlers measured the difference in corneal thickness (in microns) between the two eyes of eight patients. Each patient had one eye that had glaucoma and one eye that was normal. The difference was measured as the corneal thickness of normal eye – corneal thickness of eye with Glaucoma. Corneal thickness is important because it can mask an accurate reading of eye pressure. Use ? = .05. Q)Conduct a hypothesis test to determine if there is sufficient evidence to conclude that corneal thickness is different in normal eyes compared to eyes with glaucoma? Write up your results using the 8 steps.arrow_forwardAn experiment was conducted to study the extrusion process of biodegradable packaging foam. Two of the factors considered for their effect on the foam diameter (mm) were the die temperature(145°C vs.155°C) and the die diameter (3 mm vs. 4 mm). The results are in the accompanying data table. The question are attached in a photoarrow_forwardThe average concentration of cadmium (Cd) in tea leaves sample is 68.0(±1.5) ppm Cd. Calculate .8 * the coefficient of variation (CV) for sample is 2.2 O 0.11 O 0.012 O 3.4 O 0.012 Oarrow_forward
arrow_back_ios
SEE MORE QUESTIONS
arrow_forward_ios
Recommended textbooks for you
 College Algebra (MindTap Course List)AlgebraISBN:9781305652231Author:R. David Gustafson, Jeff HughesPublisher:Cengage Learning
College Algebra (MindTap Course List)
Algebra
ISBN:9781305652231
Author:R. David Gustafson, Jeff Hughes
Publisher:Cengage Learning
Probability & Statistics (28 of 62) Basic Definitions and Symbols Summarized; Author: Michel van Biezen;https://www.youtube.com/watch?v=21V9WBJLAL8;License: Standard YouTube License, CC-BY
Introduction to Probability, Basic Overview - Sample Space, & Tree Diagrams; Author: The Organic Chemistry Tutor;https://www.youtube.com/watch?v=SkidyDQuupA;License: Standard YouTube License, CC-BY