
Videos
Parents are frequently concerned when their child seems slow to begin walking (although when the child finally walks, the resulting havoc sometimes has the parents wishing they could turn back the clock!). The article “Walking in the Newborn” (Science, 176 [1972]: 314–315) reported on an experiment in which the effects of several different treatments on the age at which a child first walks were compared.
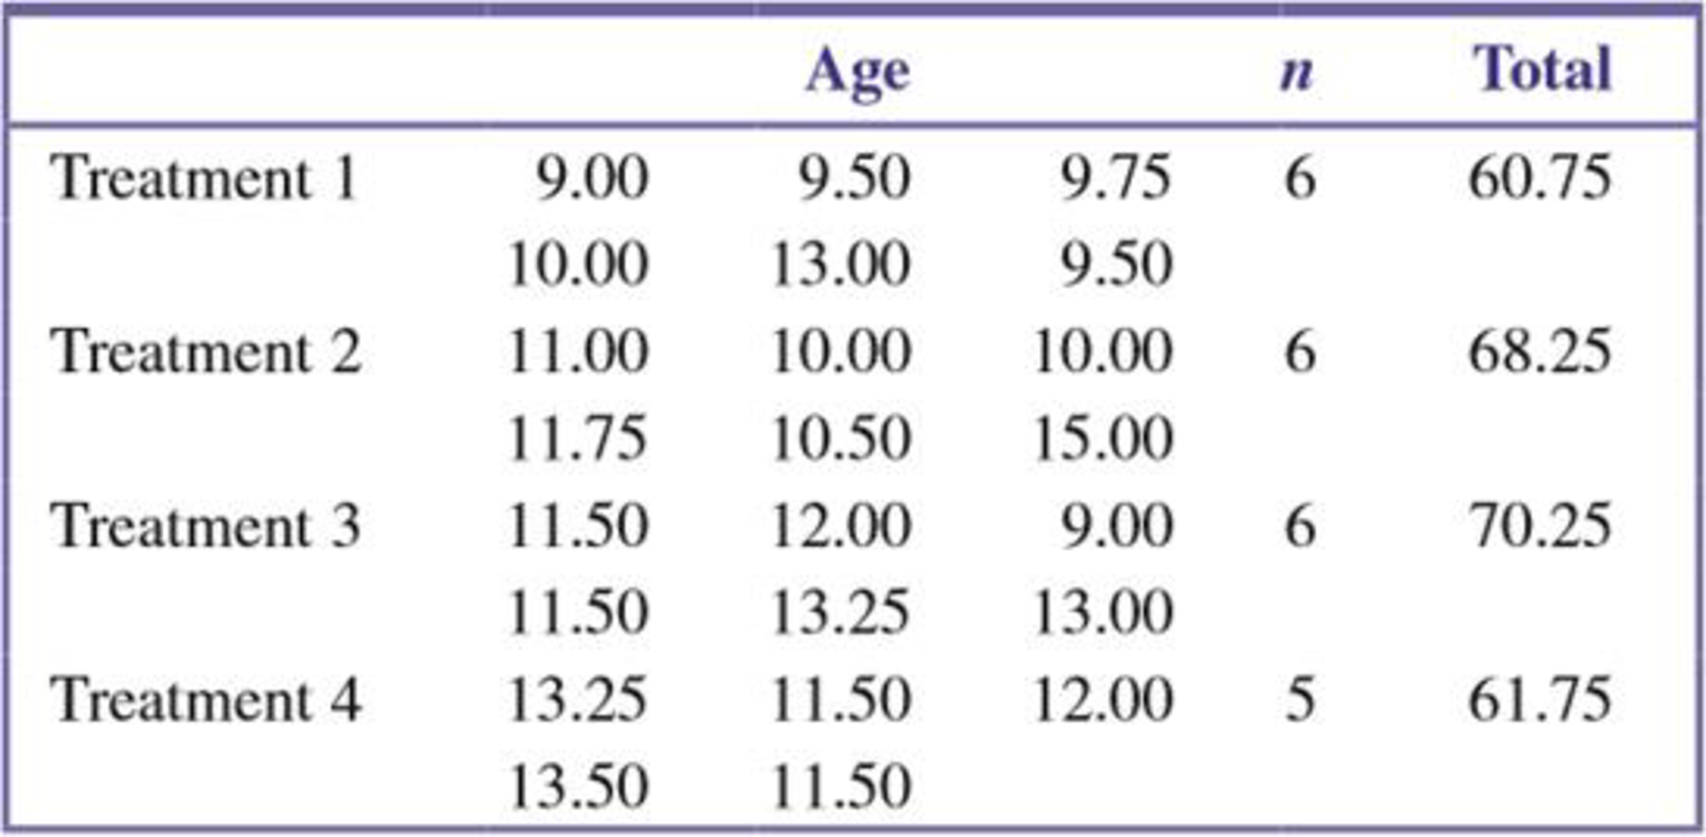
Children in the first group were given special walking exercises for 12 minutes per day beginning at age 1 week and lasting 7 weeks. The second group of children received daily exercises but not the walking exercises administered to the first group. The third and fourth groups were control groups: They received no special treatment and differed only in that the third group’s progress was checked weekly, whereas the fourth group’s progress was checked just once at the end of the study.
Observations on age (in months) when the children first walked are shown in the accompanying table. Also given is the ANOVA table, obtained from the SPSS statistical software package.
Analysis of Variance
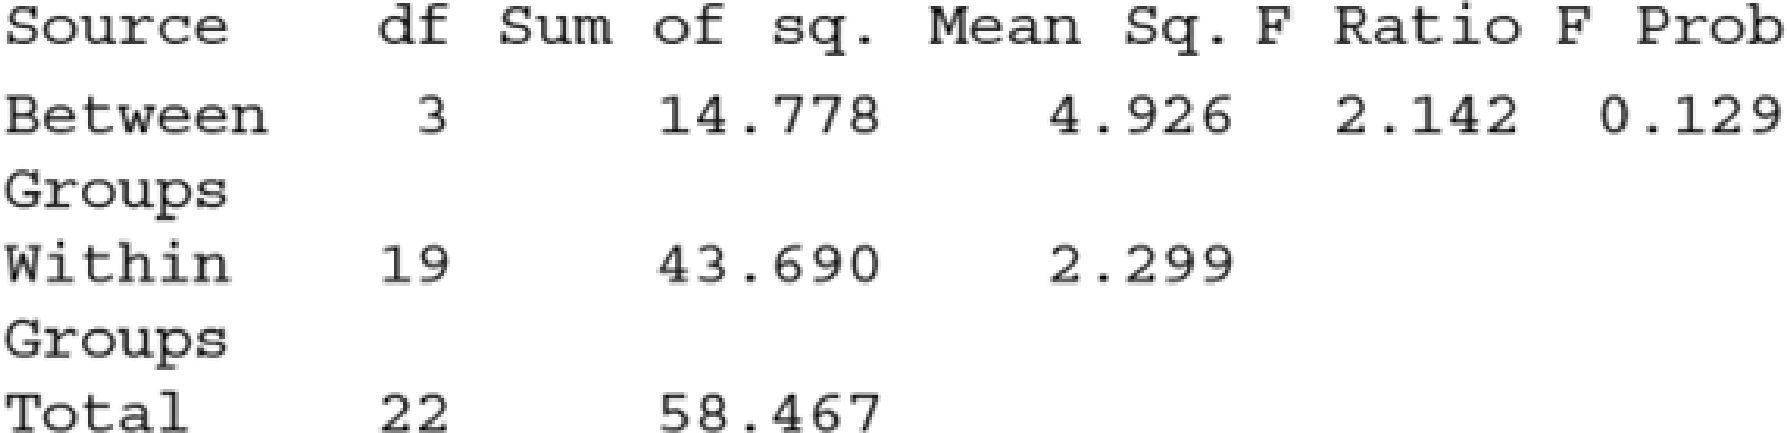
- a. Verify the entries in the ANOVA table.
- b. State and test the relevant hypotheses using a significance level of 0.05.

Trending nowThis is a popular solution!

Chapter 15 Solutions
Introduction To Statistics And Data Analysis


- Repeat Example 5 when microphone A receives the sound 4 seconds before microphone B.arrow_forwardUrban Travel Times Population of cities and driving times are related, as shown in the accompanying table, which shows the 1960 population N, in thousands, for several cities, together with the average time T, in minutes, sent by residents driving to work. City Population N Driving time T Los Angeles 6489 16.8 Pittsburgh 1804 12.6 Washington 1808 14.3 Hutchinson 38 6.1 Nashville 347 10.8 Tallahassee 48 7.3 An analysis of these data, along with data from 17 other cities in the United States and Canada, led to a power model of average driving time as a function of population. a Construct a power model of driving time in minutes as a function of population measured in thousands b Is average driving time in Pittsburgh more or less than would be expected from its population? c If you wish to move to a smaller city to reduce your average driving time to work by 25, how much smaller should the city be?arrow_forward
 Functions and Change: A Modeling Approach to Coll...AlgebraISBN:9781337111348Author:Bruce Crauder, Benny Evans, Alan NoellPublisher:Cengage Learning
 Linear Algebra: A Modern IntroductionAlgebraISBN:9781285463247Author:David PoolePublisher:Cengage Learning
 Calculus For The Life SciencesCalculusISBN:9780321964038Author:GREENWELL, Raymond N., RITCHEY, Nathan P., Lial, Margaret L.Publisher:Pearson Addison Wesley,
 Holt Mcdougal Larson Pre-algebra: Student Edition...AlgebraISBN:9780547587776Author:HOLT MCDOUGALPublisher:HOLT MCDOUGAL
 Glencoe Algebra 1, Student Edition, 9780079039897...AlgebraISBN:9780079039897Author:CarterPublisher:McGraw Hill
 Trigonometry (MindTap Course List)TrigonometryISBN:9781337278461Author:Ron LarsonPublisher:Cengage Learning