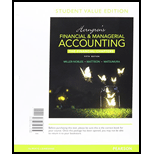
Horngren's Financial & Managerial Accounting, The Financial Chapters (Book & Access Card)
5th Edition
ISBN: 9780134078939
Author: Tracie L. Miller-Nobles, Brenda L. Mattison, Ella Mae Matsumura
Publisher: PEARSON
expand_more
expand_more
format_list_bulleted
Textbook Question
Chapter 15, Problem 15.34BP
Computing trend analysis and return on common equity
Net sales revenue, net income, and common
Requirements
- 1. Compute trend analyses for each item for 2015-2017. Use 2014 as the base year, and round to the nearest whole percent.
- 2. Compute the
rate of return on common stockholders' equity for 2015- 2017, rounding to three decimal places.
Expert Solution & Answer
Want to see the full answer?
Check out a sample textbook solutionStudents have asked these similar questions
Computing trend analysis and return on common equity
Net sales revenue, net income, and common stockholders’ equity for Azbel Mission Corporation, a manufacturer of contact lenses, follow for a four-year period.
Requirements
Compute trend analyses for each item for 2017-2019. Use 2016 as the base year, and round to the nearest whole percent.
Compute the rate of return on common stockholders’ equity for 2017-2019, rounding to three decimal places.
Net sales revenue, net income, and common stockholders' equity for Eyesight Mission Corporation, a manufacturer of contact lenses, follow for a four-year period.
E (Click the icon to view the net sales revenue, net income, and common equity)
Read the requirements.
Requirement 1. Compute trend analyses for each item for 2017-2019. Use 2016 as the base year, and round to the nearest whole percent.
Begin by computing Eyesight Mission Corporation's trend analysis for net sales revenue, then compute Eyesignt Mission Corporation's trend analysis for net income and finally compute Eyesight Mission Corporation's trend analysis for com
2019
2018
2017
2016
Net Sales Revenue
766,000
708,000
644.000
664,000
Trend Percentages
115 %
107 %
97 %
100 %
Net Income
60,000
$4
38,000 $
36.000
2.
44.000
Trend Percentages
136 %
86 %
82 %
100 %
Ending Common Stockholdors' Equity
368,000
352 000 $
326,000 $ 296,000
Trend Percentages
124 %
119 %
110
100 %
% OTI
Requirement 2. Compute the rate of return on…
Computing trend analysis and return on common equity
Net sales revenue, net income, and common stockholders’ equity for Eyesight Mission Corporation, a manufacturer of contact lenses, follow for a four-year period.
Requirements
Compute trend analyses for each item for 2017-2019. Use 2016 as the base year, and round to the nearest whole percent.
Compute the rate of return on common stockholders’ equity for 2017-2019, rounding to three decimal places.
Chapter 15 Solutions
Horngren's Financial & Managerial Accounting, The Financial Chapters (Book & Access Card)
Ch. 15 - What part of the Libertys annual report is written...Ch. 15 - Horizontal analysis of Liberty's balance sheet for...Ch. 15 - Vertical analysis of Liberty's balance sheet for...Ch. 15 - Which statement best describes Liberty's acid-test...Ch. 15 - Liberty's inventory turnover during 2017 was...Ch. 15 - Prob. 6QCCh. 15 - Prob. 7QCCh. 15 - Liberty's rate of return on common stockholders'...Ch. 15 - The company has 2,500 shares of common stock...Ch. 15 - Prob. 10AQC
Ch. 15 - What ate the three main ways to analyze financial...Ch. 15 - What is an annual report? Briefly describe the key...Ch. 15 - Prob. 3RQCh. 15 - What is trend analysis, and how does it differ...Ch. 15 - Prob. 5RQCh. 15 - Prob. 6RQCh. 15 - Prob. 7RQCh. 15 - Briefly describe the ratios that can be used to...Ch. 15 - Prob. 9RQCh. 15 - Briefly describe the ratios that can be used to...Ch. 15 - Briefly describe the ratios that can be used to...Ch. 15 - Prob. 12RQCh. 15 - Prob. 13RQCh. 15 - Prob. 14RQCh. 15 - Prob. 15RQCh. 15 - Prob. 15.1SECh. 15 - Performing horizontal analysis McDonald Corp....Ch. 15 - Calculating trend analysis Variline Corp. reported...Ch. 15 - Performing vertical analysis Hoosier Optical...Ch. 15 - Preparing common-size income statement Data for...Ch. 15 - Shine's Companies, a home improvement store chain,...Ch. 15 - Shine's Companies, a home improvement store chain,...Ch. 15 - Shine's Companies, a home improvement store chain,...Ch. 15 - Prob. 15.9SECh. 15 - Prob. 15.10SECh. 15 - Prob. 15.11SECh. 15 - Using ratios to reconstruct a balance sheet...Ch. 15 - Prob. 15.13SECh. 15 - Prob. 15.14SECh. 15 - Prob. 15.15ECh. 15 - Computing trend analysis Grand Oaks Realty's net...Ch. 15 - Prob. 15.17ECh. 15 - Prob. 15.18ECh. 15 - Prob. 15.19ECh. 15 - Prob. 15.20ECh. 15 - Analyzing the ability to pay liabilities Big Bend...Ch. 15 - Analyzing profitability Varsity, Inc.s comparative...Ch. 15 - Prob. 15.23ECh. 15 - Using ratios to reconstruct a balance sheet The...Ch. 15 - Prob. 15.25ECh. 15 - Computing earnings per share Falconi Academy...Ch. 15 - Prob. 15.27APCh. 15 - Prob. 15.28APCh. 15 - Prob. 15.29APCh. 15 - Prob. 15.30APCh. 15 - Using ratios to evaluate a stock investment...Ch. 15 - Prob. 15.32APCh. 15 - Preparing an income statement The following...Ch. 15 - Computing trend analysis and return on common...Ch. 15 - Prob. 15.35BPCh. 15 - Prob. 15.36BPCh. 15 - Determining the effects of business transactions...Ch. 15 - Prob. 15.38BPCh. 15 - Prob. 15.39BPCh. 15 - Prob. 15.40BPCh. 15 - Prob. 15.41CPCh. 15 - Lance Berkman is the controller of Saturn, a dance...Ch. 15 - Prob. 15.1CTEI
Knowledge Booster
Learn more about
Need a deep-dive on the concept behind this application? Look no further. Learn more about this topic, accounting and related others by exploring similar questions and additional content below.Similar questions
- Net sales revenue, net income, and common stockholders' equity for Eyesight Mission Corporation, a manufacturer of contact lenses, follow for a four-year period. E (Click the icon to view the net sales revenue, net income, and common equity) Read the requirements. Requirement 1. Compute trend analyses for each item for 2017 2019 Use 2016 as the base year, and round to the nearest whole percent. Begin by computing Eyesight Mission Corporation's trend analysis for net sales revenue, then compute Eyesight Mission Corporation's trend analysis for net income and finally compute Eyesight Mission Corporation's trend analysis for common stockholders' equity 2019 2018 2017 2016 Net Sales Revenue $4 766,000 $4 708 000 644 000 664,000 Trend Percentages 100 % Requirements 2019 2018 2017 2016 766,000 $ 708,000 $ 644,000 $ 664,000 44,000 Net Sales Revenue $4 Net Income 60,000 38,000 36,000 Ending Common Stockholders' Equity 368,000 352,000 326,000 296,000arrow_forward- Your answer is partially correct. Make a 5-year trend analysis, using 2016 as the base year, of (1) net sales and (2) net income. Comment on the significance of the trend results. (To satisfy this requirement you must access information regarding performance in prior years. This information is provided in the complete annual report available on the company's website.) (Round percentages to 0 decimal places, eg. 15% and enter amounts in millions) (1) Net sales Trend (2) Net income Trend $ $ eTextbook and Media 2020 274515 27 57411 26 % % $ $ 2019 APPLE INC. Trend Analysis of Net Sales and Net Income For the Five Years Ended 2020 2018 260174 21 55256 21 % % $ $ PRAL 265595 23 59531 30 % % $ $ 2017 229234 6 48351 6 % % $ $ 2016 215639 0 45687 0 % % Assistance Usedarrow_forward不 Net sales, net income, and total assets for Alex Shipping, Inc., for a five-year period follow: (Click the icon to view the data.) Read the requirements. Requirement 1. Calculate trend percentages for each item for 2018 through 2021. Use 2017 as the base year and round to the nearest percent. Alex Shipping, Inc. - Trend Percentages Net sales Net income Total assets 2021 2020 2019 2018 2017 199 % 161 % 115% 99% 100% 100 % 146 % 100% 123% 34 % 94% 100% 124 % 108 % 100% Requirement 2. Calculate the rate of return on net sales for 2019 through 2021, rounding to the nearest one-tenth percent. Explain what this means. Begin by selecting the rate of return on net sales (return on sales) formula and enter the amounts to calculate the percentages. (Enter amounts in thousands as provided to you in the problem statement. Complete all input fields. Enter "O" for any zero amounts and enter the return on sales amounts as percentages rounded to one-tenth percent, XX%.) ) 2019 2020 2021 ( ( Net…arrow_forward
- Compute trend percentages forRolling Hills Realtors' net revenue and net income for the following five-year period, using 2016 as the base year. Which grew faster during the period, net revenue or net income? Enter trend percentage values for net revenue and net income in the table below. (Enter the results as a percentage.) 2020 2019 2018 2017 2016 Net revenue. . . . . . % % % % % Net income. . . . . . . % % % % % Data table (in thousands) 2020 2019 2018 2017 2016 Net revenue. . . . . . $1,271 $1,148 $1,066 $943 $1,025 Net income. . . . . . . $180 $168 $126 $96 $120arrow_forwardUsing Yahoo Finance for your data & information, calculate the following items for the public company, WK Kellogg Co (KLG), showing your work: a. Value using industry average P/E ratio for trailing 12 months EPS. b. P/E ratio for most recent fiscal year end earnings. c. How does Kellogg's P/E ratio compare to others in the industry?arrow_forwardComputing trend analysis Grand Oaks Realty’s net revenue and net income for the following five—year period, using 2015 as the base year, follow: Requirements Compute a trend analysis for net revenue and net income. Round to the nearest full percent. Which grew faster during the period, net revenue or net income?arrow_forward
- Compute trend percentages for the following items taken from the financial statements of Lopez Plumbing over a five-year period. Treat 2014 as the base year. State whether the trends are favorable or unfavorable. (Dollar amounts are stated in thousands.) 2018 2017 2016 2015 2014 Sales $81,400 $74,000 $61,500 $59,000 $50,000 Cost of Goods Sold 58,500 48,000 40,500 37,000 30,000arrow_forwardplease read instructions.arrow_forwardAccess the February 21, 2017, filing of the December 31, 2016, 10-K report of The Hershey Company (ticker: HSY) at SEC.gov and complete the following requirements. Required Compute or identify the following profitability ratios of Hershey for its years ending December 31, 2016, and December 31, 2015. Interpret its profitability using the results obtained for these two years. 1. Profit margin ratio (round the percent to one decimal). 2. Gross profit ratio (round the percent to one decimal). 3. Return on total assets (round the percent to one decimal). (Total assets at year-end 2014 were $5,622,870 in thousands.) 4. Return on common stockholders’ equity (round the percent to one decimal). (Total shareholders’ equity at year-end 2014 was $1,519,530 in thousands.) 5. Basic net income per common share (round to the nearest cent).arrow_forward
- Calculate the following ratios for 2021 using working Excel formulas. Make sure to label each appropriately using the following cell (number of days, number of times, etc.) Round each answer to 2 decimal places (example: ROE of .1678 should display as 16.78%): Current Ratio Quick Ratio Debt to Equity Ratio Equity Multiplier Times Interest Earned Dividend Yield Inventory Turnover Days’ Sales in Inventory Receivables Turnover Days’ Sales in Receivables Total Asset Turnover Profit Margin Return on Assets Return on Equity P/E Ratio 2.Calculate Return on Equity (ROE) for 2021 using the Dupontarrow_forwardWhat is the year-over-year revenue change percent? Use the attached financial data to calculate the ratios for 2022. Round to the nearest decimal. Abercrombie & Fitch Co (ANF) Financial Data Revenues Cost of Sales Total Operating Expenses Interest Expense Income Tax Expense Diluted Weighted Shares Outstanding Cash + Equivalents Accounts Receivable Inventories Total Current Assets Total Assets Accounts Payable Total Current Liabilities Total Stockholders' Equity ANF Stock Price = $10.30 Select one O A. 5.3% B. 14.4% C. -1.4% O D. -3.5% 2022 $3,659.3 $1,545.9 $2,026.9 $28.5 $37.8 52.8 $257.3 $108.5 $742.0 $1,220.4 $2,694.0 $322.1 $935.5 $656.1 2021 $3,712.8 $1,400.8 $1,968.9 $34.1 $38.9 62.6 $823.1 $69.1 $525.9 $1,507.8 $2,939.5 $374.8 $1,015.2 $826.1arrow_forwardCalculating trend analysis Muscateer Corp reported the following revenues and net income amounts: Requirements Calculate Muscateer’s trend analysis for revenues and net income Use 2016 as the base year and round to the nearest percent. Which measure increased at a higher rate during 2017-2019?arrow_forward
arrow_back_ios
SEE MORE QUESTIONS
arrow_forward_ios
Recommended textbooks for you
- Cornerstones of Financial AccountingAccountingISBN:9781337690881Author:Jay Rich, Jeff JonesPublisher:Cengage LearningPrinciples of Accounting Volume 1AccountingISBN:9781947172685Author:OpenStaxPublisher:OpenStax CollegeFinancial AccountingAccountingISBN:9781337272124Author:Carl Warren, James M. Reeve, Jonathan DuchacPublisher:Cengage Learning
- Financial AccountingAccountingISBN:9781305088436Author:Carl Warren, Jim Reeve, Jonathan DuchacPublisher:Cengage LearningPfin (with Mindtap, 1 Term Printed Access Card) (...FinanceISBN:9780357033609Author:Randall Billingsley, Lawrence J. Gitman, Michael D. JoehnkPublisher:Cengage LearningPFIN (with PFIN Online, 1 term (6 months) Printed...FinanceISBN:9781337117005Author:Randall Billingsley, Lawrence J. Gitman, Michael D. JoehnkPublisher:Cengage Learning
Cornerstones of Financial Accounting
Accounting
ISBN:9781337690881
Author:Jay Rich, Jeff Jones
Publisher:Cengage Learning
Principles of Accounting Volume 1
Accounting
ISBN:9781947172685
Author:OpenStax
Publisher:OpenStax College
Financial Accounting
Accounting
ISBN:9781337272124
Author:Carl Warren, James M. Reeve, Jonathan Duchac
Publisher:Cengage Learning
Financial Accounting
Accounting
ISBN:9781305088436
Author:Carl Warren, Jim Reeve, Jonathan Duchac
Publisher:Cengage Learning
Pfin (with Mindtap, 1 Term Printed Access Card) (...
Finance
ISBN:9780357033609
Author:Randall Billingsley, Lawrence J. Gitman, Michael D. Joehnk
Publisher:Cengage Learning
PFIN (with PFIN Online, 1 term (6 months) Printed...
Finance
ISBN:9781337117005
Author:Randall Billingsley, Lawrence J. Gitman, Michael D. Joehnk
Publisher:Cengage Learning
Investing For Beginners (Stock Market); Author: Daniel Pronk;https://www.youtube.com/watch?v=6Jkdpgc407M;License: Standard Youtube License