Horngren's Financial & Managerial Accounting, The Financial Chapters (Book & Access Card)
5th Edition
ISBN: 9780134078939
Author: Tracie L. Miller-Nobles, Brenda L. Mattison, Ella Mae Matsumura
Publisher: PEARSON
expand_more
expand_more
format_list_bulleted
Videos
Textbook Question
Chapter 15, Problem 15.31AP
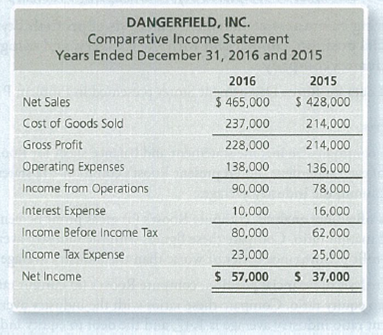
Using ratios to evaluate a stock investment
Comparative financial statement data of Dangerfield, Inc. follow:
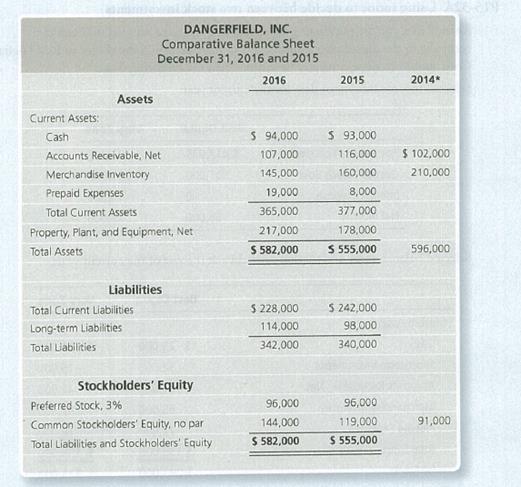
* Selected 2014 amounts
- 1. Marker price of Dangerfield's common stock: $76.67 at December 31, 20 16, and $37.20 at December 31, 2015.
- 2. Common shares outstanding: 13,000 during 2016 and 11,000 during 2015 and 2014.
- 3. All sales are on credit.
Requirements
- 1. Compute the following ratios for 2016 and 2015:
- a.
Current ratio - b. Cash ratio
- c. Times-interest-earned ratio
- d. Inventory turnover
- e. Gross profit percentage
- f. Debt to equity ratio
- g.
Rate of return on commonstockholders' equity - h. Earnings per share of common stock
- i. Price/earnings ratio
- a.
- 2. Decide (a) whether Dangerfield’s ability to pay debts and to sell inventory improved or deteriorated during 2016 and (b) whether the investment attractiveness of its common stock appears to have increased or decreased.
Expert Solution & Answer
Want to see the full answer?
Check out a sample textbook solution
Students have asked these similar questions
Using ratios to evaluate a stock investment
Comparative financial statement data of Garfield Inc. follow:
Market price of Garfield’s common stock:$69.36 at December 31 2018 and $38.04 at December 31, 2017.
Common shares outstanding 14, 000 on December 31, 2018 and 12,000 on December 31 2017 and 2016.
All sales are on credit.
Requirements
Compute the following ratios tor 2018 and 2017:
a. current ratio
b. Cash ratio
c. Times-interest-earned ratio
d. Inventory turnover
e. Gross profit percentage
f. Debt to equity ratio
g. Rate of return on common stockholder’s equity
h. Earnings per share of common stock
i. Price/earnings ratio
2. Decide (a) whether Garfield’s ability to pat debts and to sell inventory improved or deteriorated during 2018 and (b) whether the investment attractiveness of its common stock appears to have increased or decreased.
Comparative financial statement data of Garfield, Inc. follow:
Market price of Garfield’s common stock: $69.36 at December 31, 2018, and $38.04 at December 31, 2017.
Common shares outstanding: 14,000 on December 31, 2018 and 12,000 on December 31, 2017 and 2016.
All sales are on credit.
Compute the following ratios for 2018 and 2017:
2018
2017
a. Current ratio
b. Cash ratio
c. Times-interest-earned ratio
d. Inventory turnover
e. Gross profit percentage
f. Debt to equity ratio
g. Rate of return on common stockholders’ equity
h. Earnings per share of common stock
i. Price/earnings ratio
Decide (a) whether Garfield’s ability to pay debts and to sell inventory improved or deteriorated during 2018 and (b) whether the investment attractiveness of its common stock appears to have increased or decreased.
I need assistance on the following regarding the attached balance sheet and income statement:
Required:
a) Calculate the following financial ratios for 2016 and 2017
16. Earnings per share
17. Price-earnings ratio (Use year-end adjusted closing stock price of $57.32 for 2017 and $63.69 for 2016)
18. Dividend yield
19. Dividend payout ratio
Chapter 15 Solutions
Horngren's Financial & Managerial Accounting, The Financial Chapters (Book & Access Card)
Ch. 15 - What part of the Libertys annual report is written...Ch. 15 - Horizontal analysis of Liberty's balance sheet for...Ch. 15 - Vertical analysis of Liberty's balance sheet for...Ch. 15 - Which statement best describes Liberty's acid-test...Ch. 15 - Liberty's inventory turnover during 2017 was...Ch. 15 - Prob. 6QCCh. 15 - Prob. 7QCCh. 15 - Liberty's rate of return on common stockholders'...Ch. 15 - The company has 2,500 shares of common stock...Ch. 15 - Prob. 10AQC
Ch. 15 - What ate the three main ways to analyze financial...Ch. 15 - What is an annual report? Briefly describe the key...Ch. 15 - Prob. 3RQCh. 15 - What is trend analysis, and how does it differ...Ch. 15 - Prob. 5RQCh. 15 - Prob. 6RQCh. 15 - Prob. 7RQCh. 15 - Briefly describe the ratios that can be used to...Ch. 15 - Prob. 9RQCh. 15 - Briefly describe the ratios that can be used to...Ch. 15 - Briefly describe the ratios that can be used to...Ch. 15 - Prob. 12RQCh. 15 - Prob. 13RQCh. 15 - Prob. 14RQCh. 15 - Prob. 15RQCh. 15 - Prob. 15.1SECh. 15 - Performing horizontal analysis McDonald Corp....Ch. 15 - Calculating trend analysis Variline Corp. reported...Ch. 15 - Performing vertical analysis Hoosier Optical...Ch. 15 - Preparing common-size income statement Data for...Ch. 15 - Shine's Companies, a home improvement store chain,...Ch. 15 - Shine's Companies, a home improvement store chain,...Ch. 15 - Shine's Companies, a home improvement store chain,...Ch. 15 - Prob. 15.9SECh. 15 - Prob. 15.10SECh. 15 - Prob. 15.11SECh. 15 - Using ratios to reconstruct a balance sheet...Ch. 15 - Prob. 15.13SECh. 15 - Prob. 15.14SECh. 15 - Prob. 15.15ECh. 15 - Computing trend analysis Grand Oaks Realty's net...Ch. 15 - Prob. 15.17ECh. 15 - Prob. 15.18ECh. 15 - Prob. 15.19ECh. 15 - Prob. 15.20ECh. 15 - Analyzing the ability to pay liabilities Big Bend...Ch. 15 - Analyzing profitability Varsity, Inc.s comparative...Ch. 15 - Prob. 15.23ECh. 15 - Using ratios to reconstruct a balance sheet The...Ch. 15 - Prob. 15.25ECh. 15 - Computing earnings per share Falconi Academy...Ch. 15 - Prob. 15.27APCh. 15 - Prob. 15.28APCh. 15 - Prob. 15.29APCh. 15 - Prob. 15.30APCh. 15 - Using ratios to evaluate a stock investment...Ch. 15 - Prob. 15.32APCh. 15 - Preparing an income statement The following...Ch. 15 - Computing trend analysis and return on common...Ch. 15 - Prob. 15.35BPCh. 15 - Prob. 15.36BPCh. 15 - Determining the effects of business transactions...Ch. 15 - Prob. 15.38BPCh. 15 - Prob. 15.39BPCh. 15 - Prob. 15.40BPCh. 15 - Prob. 15.41CPCh. 15 - Lance Berkman is the controller of Saturn, a dance...Ch. 15 - Prob. 15.1CTEI
Knowledge Booster


Learn more about
Need a deep-dive on the concept behind this application? Look no further. Learn more about this topic, accounting and related others by exploring similar questions and additional content below.Similar questions
- Ratio Analysis Consider the following information taken from the stockholders equity section: How do you interpret the companys payout and profitability performance? Required: 1. Calculate the following for 2020. (Note. Round answers to two decimal places.) 2. CONCEPTUAL CONNECTION Assume 2019 ratios were: and the current year industry averages are: How do you interpret the companys payout and profitability performance?arrow_forwardStockholder Profitability Ratios The following information pertains to Montague Corporation Required: Calculate the return on common equity and the earnings per share. (Note: Round answers to two decimal places.)arrow_forwardUsing the data in exhibits C2.1 and C2.3, calculate and analyze the firm’s 2012 and 2013 ratios. Enter the ratios in the table below in the 2012 and 2013 columns, respectively: Ratio Type 2012 2013 Current (times) 3.40 3.43 Quick (times) 2.18 1.83 Debt (%) Times interest earned (times) Inventory turnover (times) Total asset turnover (times) Average collections period (days) Return on equity (%)arrow_forward
- Requirement 1. Compute the following ratios for both companies for the current year, and decide which company’s stock better fits your investment strategy. a. Acid-test ratio b. Inventory turnover c. Days’ sales in receivables d. Debt ratio e. Earnings per share of common stock f. Price/earnings ratio g. Dividend payoutarrow_forwardRequired:a. Calculate the following ratios for Sweets plc for 2021 and 2020, showing the formulas and workings:1- ROCE2- ROE3- Earnings per share4- Net profit margin5- Asset turnover6- Stock holding days7- Debtors collection period8- Current ratio9- Gearing ratio10- Interest coverarrow_forwardCompute DuPont Analysis Ratios Selected balance sheet and income statement information for Humana Inc., a health and well-being company, follows. 2018 2017 Company ($ millions) Ticker Revenue income Assets Assets Humana Inc HUM $66,832 $11,603 $35,333 $37,098 2018 Compute the following 2018 ratios for Humana. a. Return on equity (ROE) $ $ Note: 1. Select the appropriate numerator and denominator used to compute ROE from the drop-down menu options. 2. Enter the numerator and denominator amounts to compute ROE. Numerator Denominator 0 $ $ 2018 Net 2018 2017 Stockholders' Stockholders' 0 $ ♦ 0 b. Profit margin (PM) Note: 1. Select the appropriate numerator and denominator used to compute PM from the drop-down menu options. 2. Enter the numerator and denominator amounts to compute PM. Numerator Denominator 0 $ ◆ Equity $20,081 0 ROE 0 PM c. Financial leverage (FL) Note: 1. Select the appropriate numerator and denominator used to compute FL from the drop-down menu options. 2. Enter the…arrow_forward
- Profitability ratiosThe following selected data were taken from the financial statements ofVidahill Inc. for December 31, 20Y7, 20Y6, and 20Y5: The 20Y7 net income was $411,000, and the 20Y6 net income was$462,500. No dividends on common stock were declared between 2045and 2017. Preferred dividends were declared and paid in full in 2016 and2017.a. Determine the return on total assets, the return tin stockholders'equity, and the return on common stockholders' equity for the years2016 and 2017. Round percentages to one decimal place.b. What conclusions can be drawn from these data as to the company'sprofitability?arrow_forwardComputing earnings per share, price/earnings ratio, and rate of return on common stockholders’ equity Gullo Company reported these figures for 2018 and 2017: Requirements Compute Gullo Company’s earnings per share for 2018. Assume the company paid the minimum preferred dividend during 2018. Round to the nearest cent. Compute Gullo Company’s price/earnings ratio for 2018. Assume the company’s market price per share of common stock is $9. Round to two decimals. Compute Gullo Company’s rate of return on common stockholders’ equity for 2018. Assume the company paid the minimum preferred dividend during 2018. Round to the nearest whole percent.arrow_forwardCalculation and interpretation of ratios. Data for White Star Limited: Net operating profit after tax is $25 million (2018: $38 million). 1. Use the information above to calculate for 2019 and 2018: debt-to-equity ratio return on equity ratio earnings per share ratio.arrow_forward
- Compute DuPont Analysis Ratios Selected balance sheet and income statement information for Humana Inc., a health and well‑being company, follows. 2018 2017 2018 2018 Net 2018 2017 Stockholders’ Stockholders’ Company ($ millions) Ticker Revenue income Assets Assets Equity Equity Humana Inc HUM $66,610 $11,381 $35,111 $36,876 $19,859 $19,540 Compute the following 2018 ratios for Humana. a. Return on equity (ROE) Note: 1. Select the appropriate numerator and denominator used to compute ROE from the drop-down menu options. 2. Enter the numerator and denominator amounts to compute ROE. Numerator Denominator ROE Answer Answer Answer Answer b. Profit margin (PM) Note: 1. Select the appropriate numerator and denominator used to compute PM from the drop-down menu options. 2. Enter the numerator and denominator amounts to compute PM. Numerator Denominator PM Answer Answer Answer Answer c. Financial leverage…arrow_forwardCompute the following ratios for 2014 . (a) Earnings per share. (b) Return on common stockholders' equity? answer with workingarrow_forwardUsing the data in exhibits C2.1 and C2.3, calculate and analyze the firm’s 2012 and 2013 ratios. Enter the ratios in the table below in the 2012 and 2013 columns, respectively: Total asset turnover (times) Average collections period (days) Return on equity (%)arrow_forward
arrow_back_ios
SEE MORE QUESTIONS
arrow_forward_ios
Recommended textbooks for you
 Cornerstones of Financial AccountingAccountingISBN:9781337690881Author:Jay Rich, Jeff JonesPublisher:Cengage Learning
 Financial AccountingAccountingISBN:9781305088436Author:Carl Warren, Jim Reeve, Jonathan DuchacPublisher:Cengage Learning
 Century 21 Accounting Multicolumn JournalAccountingISBN:9781337679503Author:GilbertsonPublisher:Cengage
Cornerstones of Financial Accounting
Accounting
ISBN:9781337690881
Author:Jay Rich, Jeff Jones
Publisher:Cengage Learning
Financial Accounting
Accounting
ISBN:9781305088436
Author:Carl Warren, Jim Reeve, Jonathan Duchac
Publisher:Cengage Learning
Century 21 Accounting Multicolumn Journal
Accounting
ISBN:9781337679503
Author:Gilbertson
Publisher:Cengage
Financial ratio analysis; Author: The Finance Storyteller;https://www.youtube.com/watch?v=MTq7HuvoGck;License: Standard Youtube License