
Concept explainers
Videos
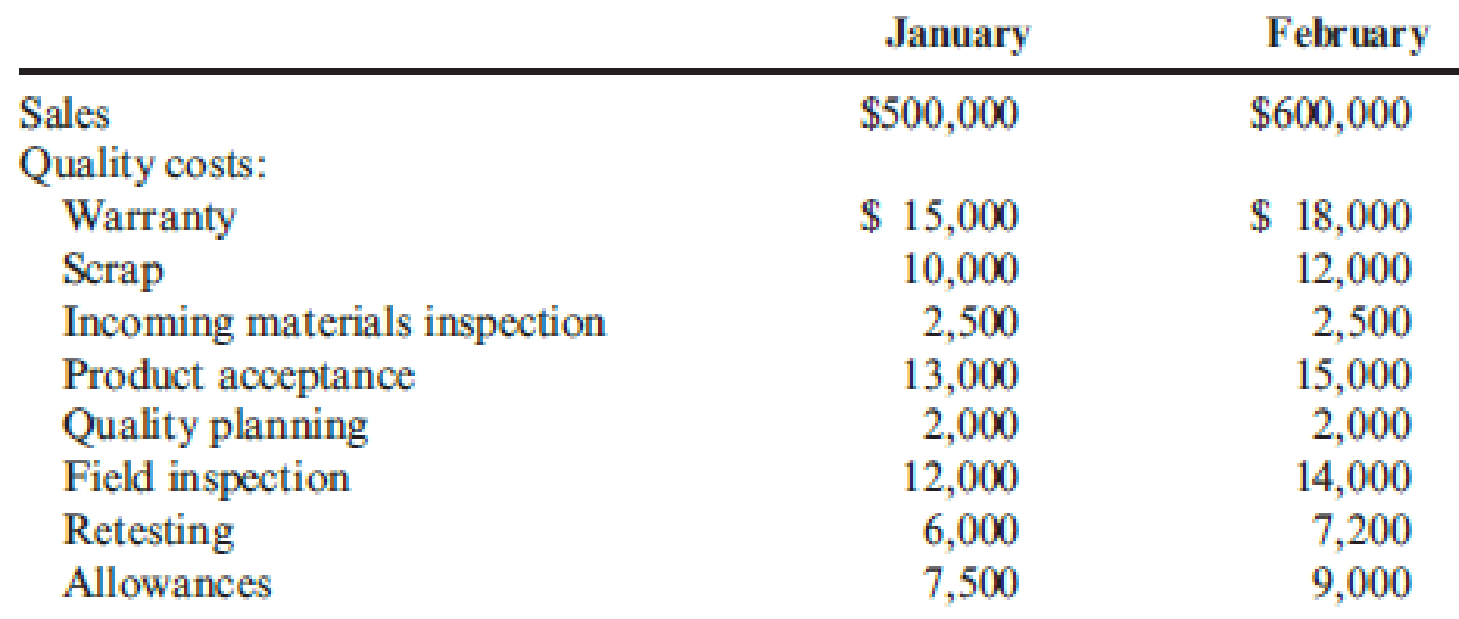
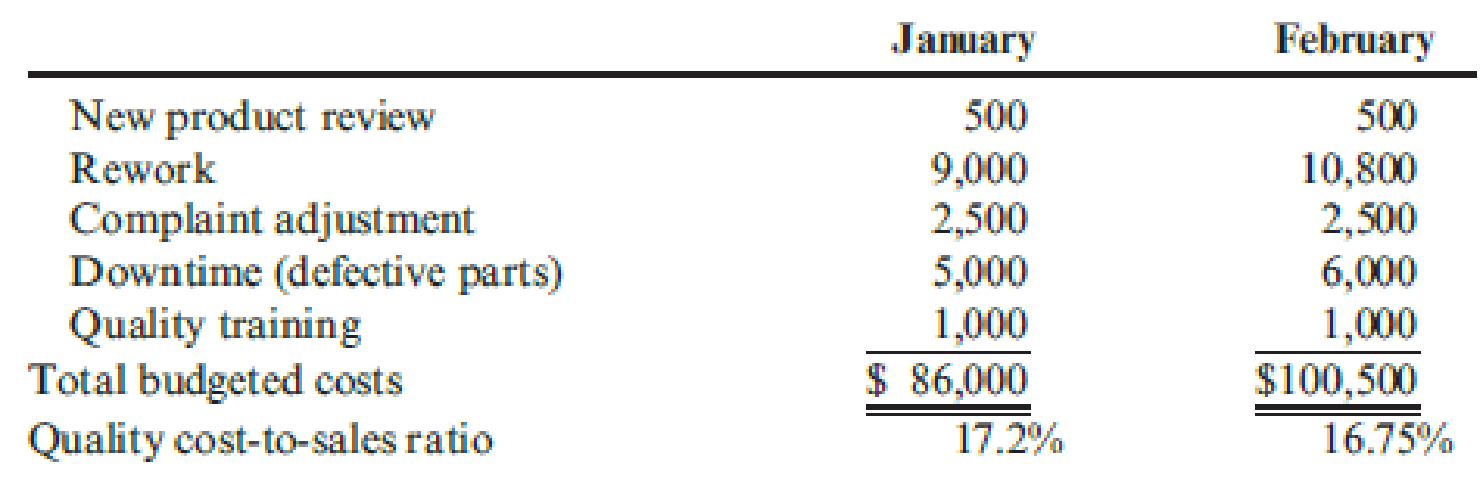
Recently, Ulrich Company received a report from an external consulting group on its quality costs. The consultants reported that the company’s quality costs total about 21 percent of its sales revenues. Somewhat shocked by the magnitude of the costs, Rob Rustin, president of Ulrich Company, decided to launch a major quality improvement program. For the coming year, management decided to reduce quality costs to 17 percent of sales revenues. Although the amount of reduction was ambitious, most company officials believed that the goal could be realized. To improve the monitoring of the quality improvement program, Rob directed Pamela Golding, the controller, to prepare monthly performance reports comparing budgeted and actual quality costs. Budgeted costs and sales for the first two months of the year are as follows:
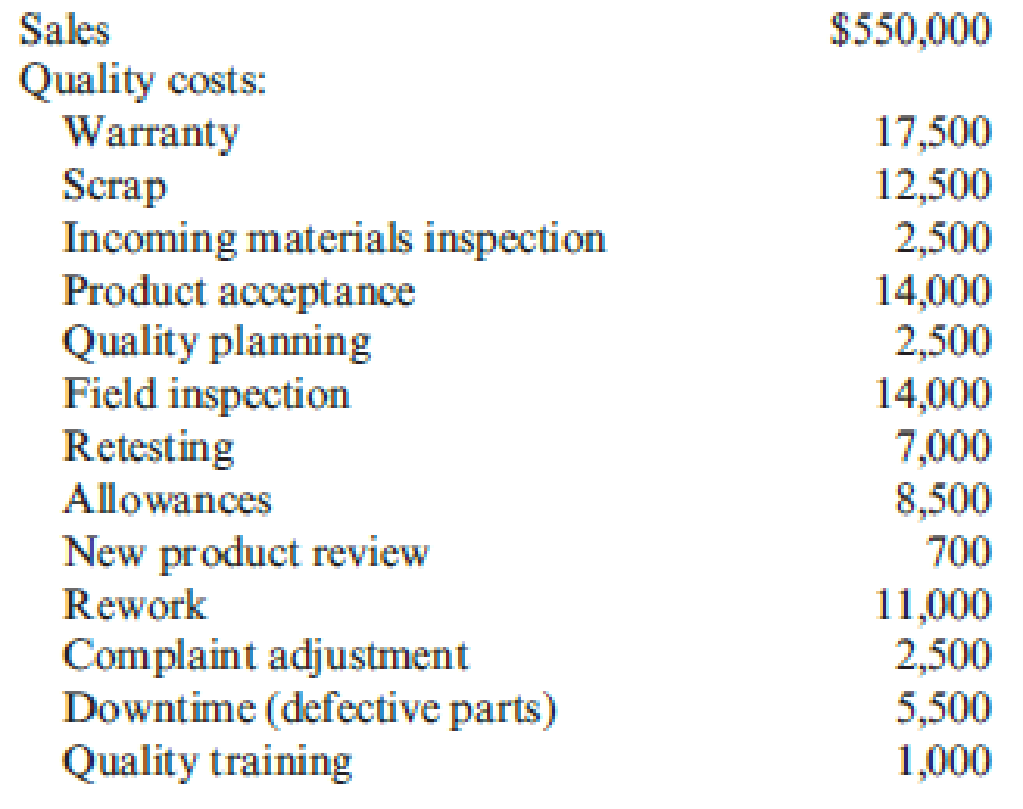
The following actual sales and actual quality costs were reported for January:
Required:
- 1. Reorganize the monthly budgets so that quality costs are grouped in one of four categories: appraisal, prevention, internal failure, or external failure. (Essentially, prepare a budgeted cost of quality report.) Also, identify each cost as variable (V) or fixed (F). (Assume that no costs are mixed.)
- 2. Prepare a performance report for January that compares actual costs with budgeted costs. Comment on the company’s progress in improving quality and reducing its quality costs.
1.
Reorganize the monthly budget, prepare a budgeted cost of quality report, and identify the type of cost as variable (V) or fixed (F).
Explanation of Solution
Quality cost performance reports: In a quality cost performance report, identification of quality standard is the main element and it has two important elements namely; actual outcomes and expected or standard outcomes.
Interim quality report: Interim quality performance report compares the actual quality at the end of the period with the budgeted costs and this report examines the progress attained within the period comparative to the planned level of progress for that period.
“Reorganize the monthly budget, prepare a budgeted cost of quality report, and identify the type of cost as variable (V) or fixed (F)”:
| Prevention costs | January | February |
| Quality planning (F) | $2,000 | $2,000 |
| New product review(F) | $500 | $500 |
| Quality training(F) | $1,000 | $1,000 |
| Total prevention costs | $3,500 | $3,500 |
| Appraisal costs | ||
| Materials inspection(F) | $2,500 | $2,500 |
| Product acceptance (V) | $13,000 | $15,000 |
| Field inspection (V) | $12,000 | $14,000 |
| Total appraisal costs | ||
| Internal failure costs | ||
| Scrap(V) | $10,000 | $12,000 |
| Retesting(V) | $6,000 | $7,200 |
| Rework(V) | $9,000 | $10,800 |
| Downtime(V) | $5,000 | $6,000 |
| Total internal failure costs | $30,000 | $36,000 |
| External failure costs | ||
| Warranty(V) | $15,000 | $18,000 |
| Allowances(V) | $7,500 | $9,000 |
| Complaint adjustment(F) | $2,500 | $2,500 |
| Total external failure costs | $25,000 | $29,500 |
| Total quality costs | $86,000 | $100,500 |
Table (1)
2.
Prepare a performance report for January that compares actual costs with budgeted costs. Comment on the progress of the company for improving quality and reducing its quality costs.
Explanation of Solution
Prepare a performance report comparing actual costs with budgeted costs and Comment on the progress of the company:
| Prevention costs: |
Actual costs (a) |
Budgeted Costs (b) |
Variance | |
| Quality planning (F) | $2,500 | $2,000 | $500 | U |
| New product review (F) | $700 | $500 | $200 | U |
| Quality training (F) | $1,000 | $1,000 | $0 | |
| Total prevention costs | $4,200 | $3,500 | $700 | U |
| Materials inspection (F) | $2,500 | $2,500 | $0 | |
| Product acceptance (V) | $14,000 | (2)$14,300 | ($300) | F |
| Field inspection (V) | $14,000 | (2)$13,200 | $800 | U |
| Total appraisal costs | $30,500 | $30,000 | $500 | U |
| Internal failure costs: | ||||
| Scrap (V) | $12,500 | (3)$11,000 | $1,500 | U |
| Retesting (V) | $7,000 | (4)$6,600 | $400 | U |
| Rework (V) | $11,000 | (5)$9,900 | $1,100 | U |
| Downtime (V) | $5,500 | (6)$5,500 | $0 | |
| Total internal failure costs | $36,000 | $33,000 | $3,000 | U |
| External failure costs: | ||||
| Warranty (V) | $17,500 | (7)$16,500 | $1,000 | U |
| Allowances (V) | $8,500 | (8)$8,250 | $250 | U |
| Complaint adjustment (F) | $2,500 | $2,500 | $0 | |
| Total external failure costs | $28,500 | $27,250 | $1,250 | U |
| Total quality costs | $99,200 | $93,750 | $5,450 | U |
Table (2)
- Budgeted costs must be adjusted to reflect actual sales of $550, 000; fixed costs usually don’t change with sales. Conversely, variable costs change with sales so that the “budgeted variable cost” could be used for making adjustment. For instance, the adjusted budgeted for scrap is $11,000(3).
- During the month of January, quality costs are 18 % (9) of sales and this is higher than the budgeted amount of 17 %, but lesser than earlier periods.
Working notes:
(1)Calculate the adjusted budget for product acceptance:
(2)Calculate the adjusted budget for field inspection:
(3)Calculate the adjusted budget for scrap:
(4)Calculate the adjusted budget for retesting:
(5)Calculate the adjusted budget for rework:
(6)Calculate the adjusted budget for downtime:
(7)Calculate the adjusted budget for warranty:
(8)Calculate the adjusted budget for allowances:
Note: Every amount of quality cost and the amount of sales is taken for the month of January.
(9)Calculate the percent of sales:
Want to see more full solutions like this?
Chapter 14 Solutions
EBK CORNERSTONES OF COST MANAGEMENT


- In 2011, Milton Thayne, president of Carbondale Electronics, received a report indicating that quality costs were 31 percent of sales. Faced with increasing pressures from imported goods, Milton resolved to take measures to improve the overall quality of the companys products. After hiring a consultant in 20x0, the company began an aggressive program of total quality control. At the end of 20x5, Milton requested an analysis of the progress the company had made in reducing and controlling quality costs. The Accounting Department assembled the following data: Required: 1. Compute the quality costs as a percentage of sales by category and in total for each year. 2. Prepare a multiple-year trend graph for quality costs, both by total costs and by category. Using the graph, assess the progress made in reducing and controlling quality costs. Does the graph provide evidence that quality has improved? Explain. 3. Using the 20x1 quality cost relationships (assume all costs are variable), calculate the quality costs that would have prevailed in 20x4. By how much did profits increase in 20x4 because of the quality improvement program? Repeat for 20x5.arrow_forwardIn 20x5, Major Company initiated a full-scale, quality improvement program. At the end of the year, Jack Aldredge, the president, noted with some satisfaction that the defects per unit of product had dropped significantly compared to the prior year. He was also pleased that relationships with suppliers had improved and defective materials had declined. The new quality training program was also well accepted by employees. Of most interest to the president, however, was the impact of the quality improvements on profitability. To help assess the dollar impact of the quality improvements, the actual sales and the actual quality costs for 20x4 and 20x5 are as follows by quality category: All prevention costs are fixed (by discretion). Assume all other quality costs are unit-level variable. Required: 1. Compute the relative distribution of quality costs for each year and prepare a pie chart. Do you believe that the company is moving in the right direction in terms of the balance among the quality cost categories? Explain. 2. Prepare a one-year trend performance report for 20x5 (compare the actual costs of 20x5 with those of 20x4, adjusted for differences in sales volume). How much have profits increased because of the quality improvements made by Major Company? 3. Estimate the additional improvement in profits if Major Company ultimately reduces its quality costs to 2.5 percent of sales revenues (assume sales of 10 million).arrow_forwardIn 20X1, Don Blackburn, president of Price Electronics, received a report indicating that quality costs were 31% of sales. Faced with increasing pressures from imported goods. Don resolved to take measures to improve the overall quality of the companys products. After hiring a consultant in 20X1, the company began an aggressive program of total quality control. At the end of 20X5, Don requested an analysis of the progress the company had made in reducing and controlling quality costs. The accounting department assembled the following data: Required: 1. Compute the quality costs as a percentage of sales by category and in total for each year. 2. Prepare a multiple-year trend graph for quality costs, both by total costs and by category. Using the graph, assess the progress made in reducing and controlling quality costs. Does the graph provide evidence that quality has improved? Explain. 3. Using the 20X1 quality cost relationships (assume all costs are variable), calculate the quality costs that would have prevailed in 20X4. By how much did profits increase in 20X4 because of the quality improvement program? Repeat for 20X5.arrow_forward
- Lindell Manufacturing embarked on an ambitious quality program that is centered on continual improvement. This improvement is operationalized by declining quality costs from year to year. Lindell rewards plant managers, production supervisors, and workers with bonuses ranging from 1,000 to 10,000 if their factory meets its annual quality cost goals. Len Smith, manager of Lindells Boise plant, felt obligated to do everything he could to provide this increase to his employees. Accordingly, he has decided to take the following actions during the last quarter of the year to meet the plants budgeted quality cost targets: a. Decrease inspections of the process and final product by 50% and transfer inspectors temporarily to quality training programs. Len believes this move will increase the inspectors awareness of the importance of quality; also, decreasing inspection will produce significantly less downtime and less rework. By increasing the output and decreasing the costs of internal failure, the plant can meet the budgeted reductions for internal failure costs. Also, by showing an increase in the costs of quality training, the budgeted level for prevention costs can be met. b. Delay replacing and repairing defective products until the beginning of the following year. While this may increase customer dissatisfaction somewhat, Len believes that most customers expect some inconvenience. Besides, the policy of promptly dealing with customers who are dissatisfied could be reinstated in 3 months. In the meantime, the action would significantly reduce the costs of external failure, allowing the plant to meet its budgeted target. c. Cancel scheduled worker visits to customers plants. This program, which has been very well received by customers, enables Lindell workers to see just how the machinery they make is used by the customer and also gives them first-hand information on any remaining problems with the machinery. Workers who went on previous customer site visits came back enthusiastic and committed to Lindells quality program. Lindells quality program staff believes that these visits will reduce defects during the following year. Required: 1. Evaluate Lens ethical behavior. In this evaluation, consider his concern for his employees. Was he justified in taking the actions described? If not, what should he have done? 2. Assume that the company views Lens behavior as undesirable. What can the company do to discourage it? 3. Assume that Len is a CMA and a member of the IMA. Refer to the ethical code for management accountants in Chapter 1. Were any of these ethical standards violated?arrow_forwardAt the beginning of the last quarter of 20x1, Youngston, Inc., a consumer products firm, hired Maria Carrillo to take over one of its divisions. The division manufactured small home appliances and was struggling to survive in a very competitive market. Maria immediately requested a projected income statement for 20x1. In response, the controller provided the following statement: After some investigation, Maria soon realized that the products being produced had a serious problem with quality. She once again requested a special study by the controllers office to supply a report on the level of quality costs. By the middle of November, Maria received the following report from the controller: Maria was surprised at the level of quality costs. They represented 30 percent of sales, which was certainly excessive. She knew that the division had to produce high-quality products to survive. The number of defective units produced needed to be reduced dramatically. Thus, Maria decided to pursue a quality-driven turnaround strategy. Revenue growth and cost reduction could both be achieved if quality could be improved. By growing revenues and decreasing costs, profitability could be increased. After meeting with the managers of production, marketing, purchasing, and human resources, Maria made the following decisions, effective immediately (end of November 20x1): a. More will be invested in employee training. Workers will be trained to detect quality problems and empowered to make improvements. Workers will be allowed a bonus of 10 percent of any cost savings produced by their suggested improvements. b. Two design engineers will be hired immediately, with expectations of hiring one or two more within a year. These engineers will be in charge of redesigning processes and products with the objective of improving quality. They will also be given the responsibility of working with selected suppliers to help improve the quality of their products and processes. Design engineers were considered a strategic necessity. c. Implement a new process: evaluation and selection of suppliers. This new process has the objective of selecting a group of suppliers that are willing and capable of providing nondefective components. d. Effective immediately, the division will begin inspecting purchased components. According to production, many of the quality problems are caused by defective components purchased from outside suppliers. Incoming inspection is viewed as a transitional activity. Once the division has developed a group of suppliers capable of delivering nondefective components, this activity will be eliminated. e. Within three years, the goal is to produce products with a defect rate less than 0.10 percent. By reducing the defect rate to this level, marketing is confident that market share will increase by at least 50 percent (as a consequence of increased customer satisfaction). Products with better quality will help establish an improved product image and reputation, allowing the division to capture new customers and increase market share. f. Accounting will be given the charge to install a quality information reporting system. Daily reports on operational quality data (e.g., percentage of defective units), weekly updates of trend graphs (posted throughout the division), and quarterly cost reports are the types of information required. g. To help direct the improvements in quality activities, kaizen costing is to be implemented. For example, for the year 20x1, a kaizen standard of 6 percent of the selling price per unit was set for rework costs, a 25 percent reduction from the current actual cost. To ensure that the quality improvements were directed and translated into concrete financial outcomes, Maria also began to implement a Balanced Scorecard for the division. By the end of 20x2, progress was being made. Sales had increased to 26,000,000, and the kaizen improvements were meeting or beating expectations. For example, rework costs had dropped to 1,500,000. At the end of 20x3, two years after the turnaround quality strategy was implemented, Maria received the following quality cost report: Maria also received an income statement for 20x3: Maria was pleased with the outcomes. Revenues had grown, and costs had been reduced by at least as much as she had projected for the two-year period. Growth next year should be even greater as she was beginning to observe a favorable effect from the higher-quality products. Also, further quality cost reductions should materialize as incoming inspections were showing much higher-quality purchased components. Required: 1. Identify the strategic objectives, classified by the Balanced Scorecard perspective. Next, suggest measures for each objective. 2. Using the results from Requirement 1, describe Marias strategy using a series of if-then statements. Next, prepare a strategy map. 3. Explain how you would evaluate the success of the quality-driven turnaround strategy. What additional information would you like to have for this evaluation? 4. Explain why Maria felt that the Balanced Scorecard would increase the likelihood that the turnaround strategy would actually produce good financial outcomes. 5. Advise Maria on how to encourage her employees to align their actions and behavior with the turnaround strategy.arrow_forwardGagnon Company reported the following sales and quality costs for the past four years. Assume that all quality costs are variable and that all changes in the quality cost ratios are due to a quality improvement program. Required: 1. Compute the quality costs for all four years. By how much did net income increase from Year 1 to Year 2 because of quality improvements? From Year 2 to Year 3? From Year 3 to Year 4? 2. The management of Gagnon Company believes it is possible to reduce quality costs to 2.5 percent of sales. Assuming sales will continue at the Year 4 level, calculate the additional profit potential facing Gagnon. Is the expectation of improving quality and reducing costs to 2.5 percent of sales realistic? Explain. 3. Assume that Gagnon produces one type of product, which is sold on a bid basis. In Years 1 and 2, the average bid was 400. In Year 1, total variable costs were 250 per unit. In Year 3, competition forced the bid to drop to 380. Compute the total contribution margin in Year 3 assuming the same quality costs as in Year 1. Now, compute the total contribution margin in Year 3 using the actual quality costs for Year 3. What is the increase in profitability resulting from the quality improvements made from Year 1 to Year 3?arrow_forward
- Javier Company has sales of 8 million and quality costs of 1,600,000. The company is embarking on a major quality improvement program. During the next three years, Javier intends to attack failure costs by increasing its appraisal and prevention costs. The right prevention activities will be selected, and appraisal costs will be reduced according to the results achieved. For the coming year, management is considering six specific activities: quality training, process control, product inspection, supplier evaluation, prototype testing, and redesign of two major products. To encourage managers to focus on reducing non-value-added quality costs and select the right activities, a bonus pool is established relating to reduction of quality costs. The bonus pool is equal to 10 percent of the total reduction in quality costs. Current quality costs and the costs of these six activities are given in the following table. Each activity is added sequentially so that its effect on the cost categories can be assessed. For example, after quality training is added, the control costs increase to 320,000, and the failure costs drop to 1,040,000. Even though the activities are presented sequentially, they are totally independent of each other. Thus, only beneficial activities need be selected. Required: 1. Identify the control activities that should be implemented, and calculate the total quality costs associated with this selection. Assume that an activity is selected only if it increases the bonus pool. 2. Given the activities selected in Requirement 1, calculate the following: a. The reduction in total quality costs b. The percentage distribution for control and failure costs c. The amount for this years bonus pool 3. Suppose that a quality engineer complained about the gainsharing incentive system. Basically, he argued that the bonus should be based only on reductions of failure and appraisal costs. In this way, investment in prevention activities would be encouraged, and eventually, failure and appraisal costs would be eliminated. After eliminating the non-value-added costs, focus could then be placed on the level of prevention costs. If this approach were adopted, what activities would be selected? Do you agree or disagree with this approach? Explain.arrow_forwardIn 20x4, Tru-Delite Frozen Desserts, Inc., instituted a quality improvement program. At the end of 20x5, the management of the corporation requested a report to show the amount saved by the measures taken during the year. The actual sales and quality costs for 20x4 and 20x5 are as follows: Tru-Delites management believes that quality costs can be reduced to 2.5 percent of sales within the next five years. At the end of 20x9, Tru-Delites sales are projected to grow to 750,000. The projected relative distribution of quality costs at the end of 20x9 is as follows: Required: 1. Profits increased by what amount due to quality improvements made in 20x5? 2. Prepare a long-range performance report that compares the quality costs incurred at the end of 20x5 with the quality cost structure expected at the end of 20x9. 3. Are the targeted costs in the year 20x9 all value-added costs? How would you interpret the variances if the targeted costs are value-added costs? 4. What would be the profit increase in 20x9 if the 2.5 percent performance standard is met in that year?arrow_forwardAt the end of 2021, Mejorar Company implemented a low-cost strategy to improve its competitive position. Its objective was to become the low-cost producer in its industry. A Balanced Scorecard was developed to guide the company toward this objective. To lower costs, Mejorar undertook a number of improvement activities such as JIT production, total quality management, and activity-based management. Now, after two years of operation, the president of Mejorar wants some assessment of the achievements. To help provide this assessment, the following information on one product has been gathered: 1. Compute the following measures for 2021 and 2023: a. actual velocity and cycle time (2021 and 2023) (My question: In the book it stated that Actual Velocity (# units produced/time) and Cycle Time (time/# units produced) However, which one is per hour and per minute Or maybe I wrong let me know?) b. Percentage of total revenue from new customers (2021 and 2023) (assume one unit per customer) c.…arrow_forward
- Dana Wise, president of Tidwell Company, recently returned from a conference on quality and productivity. At the conference, he was told that many firms have quality costs totaling 20 to 30% of sales. The quality experts at the conference convinced him that a company could increase its profitability by improving quality. However, he was of the opinion that the quality of Tidwell Company was much less than 20% - probably more in the 4 to 6% range. However, because the potential for increasing profits was so great if he was wrong, he decided to request a preliminry estimate of the total quality costs currently being incurred. He asked his controller for a summary of quality costs, with the costs classified into four categories: prevention, appraisal, internal failure, or external failure. He also wanted the costs expressed as a percentage of both sales and profits. The controller had his staff assemble the following information from the past year, 20x1: a. Sales revenue,…arrow_forwardSKE Corporation manufactures large kitchen appliances. The following represents financial information for two years: Mr. Cheung is also reviewing the quality of various production process. Recently several competitors have introduced similar prototype chips with much higher quality and causing SKE's sales to decline. Mr. Cheung has embarked an intensive campaign to strengthen its quality control at the beginning of 2023. The costs relating to quality control were complied for 2021 and the full year of 2022. The related costs are shown below 2021 2022 Process Inspection 60,000 52,800 Scrap 60,200 57,600 Quality Training 440,000 610,000 Warranty repairs 150,000 140,000 Testing equipment 230,000 230,000 Resolving customer complaints 108,400 89,000 Rework 390,000 544,000 Preventive maintenance 304,000 440,000 Material Inspection 150,000 210,000 Field Testing 400,000 300,000 Total costs $2,292,600 $2,673,400 Required: a. Prepare a cost of quality (COQ) report for 2021 and 2022, calculate…arrow_forwardIn the last 6 months, demand for one of Appleby Company's products has dropped off considerably, due mainly to it becoming obsolescent as a result of technological change. Knowing that the equipment used in the manufacture of this product may not be easy to sell, Appleby spent $50,000 on consultants to determine whether it could use the equipment to produce a new product under license by another company. The consultant has determined that this product would have variable production costs of $65 per unit and should sell at a price of $90/unit. The licensing royalty is 5% of gross product revenue. Estimated annual demand is 20,000 units per year. Additional annual operating costs related to this product are $30,000/year (excluding depreciation). Depreciation on the equipment is $15,000. Annual depreciation expense is a: O a. Sunk cost O b. Relevant cost O c. Both sunk and Irrelevant cost Od. Irrelevant costarrow_forward
 Cornerstones of Cost Management (Cornerstones Ser...AccountingISBN:9781305970663Author:Don R. Hansen, Maryanne M. MowenPublisher:Cengage Learning
 Managerial Accounting: The Cornerstone of Busines...AccountingISBN:9781337115773Author:Maryanne M. Mowen, Don R. Hansen, Dan L. HeitgerPublisher:Cengage Learning