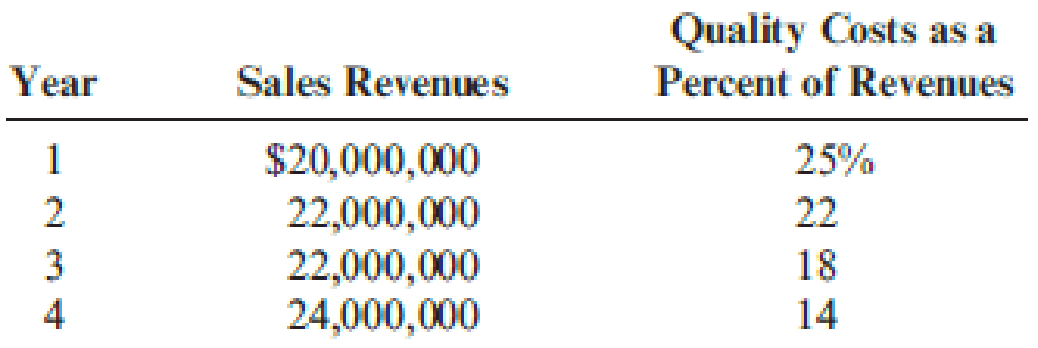
Gagnon Company reported the following sales and quality costs for the past four years. Assume that all quality costs are variable and that all changes in the quality cost ratios are due to a quality improvement program.

Required:
- 1. Compute the quality costs for all four years. By how much did net income increase from Year 1 to Year 2 because of quality improvements? From Year 2 to Year 3? From Year 3 to Year 4?
- 2. The management of Gagnon Company believes it is possible to reduce quality costs to 2.5 percent of sales. Assuming sales will continue at the Year 4 level, calculate the additional profit potential facing Gagnon. Is the expectation of improving quality and reducing costs to 2.5 percent of sales realistic? Explain.
- 3. Assume that Gagnon produces one type of product, which is sold on a bid basis. In Years 1 and 2, the average bid was $400. In Year 1, total variable costs were $250 per unit. In Year 3, competition forced the bid to drop to $380. Compute the total contribution margin in Year 3 assuming the same quality costs as in Year 1. Now, compute the total contribution margin in Year 3 using the actual quality costs for Year 3. What is the increase in profitability resulting from the quality improvements made from Year 1 to Year 3?
1.
Compute the quality costs for all four years and calculate the amount of increase in net income from year 1 to year 2, from year 2 to year 3, and from year 3 to year 4.
Explanation of Solution
Quality costs: Quality costs are costs that are incurred to avoid, identify and eliminate defects from products. Quality costs are classified into four components namely;
- “Prevention costs”.
- “Appraisal costs”.
- “Internal failure costs”.
- “External failure costs”.
Calculate the quality costs for all the four years:
| Year | Percent of revenues | × | Sales revenues | = | Quality costs |
| Year 1 | 25% | $20,000,000 | $5,000,000 | ||
| year 2 | 22% | $22,000,000 | $4,840,000 | ||
| Year 3 | 18% | $22,000,000 | $3,960,000 | ||
| Year 4 | 14% | $24,000,000 | $3,960,000 |
Table (1)
Calculate the increase in net income from year 1 to year 2:
Calculate the increase in net income from year 2 to year 3:
Calculate the increase in net income from year 3 to year 4:
2.
Calculate the additional profit potential facing Company G and state whether expecting improved quality and reduced costs to 2.5 percent of sales is realistic.
Explanation of Solution
Calculate the profit potential:
Therefore, from the above calculation, it is ascertained that amount of profit potential is $2,760,000.
The 2.5 percent goal is the level identified by several quality experts that a company must strive to obtain. The experience of company G shows that it is an achievable goal
3.
Calculate the total contribution margin in year 3 assuming the same quality costs as in year 1 compute the total contribution margin in year 3 using the actual quality costs for year 3 and calculate the increase in profitability resulting from the quality improvements made from year 1 to year 3.
Explanation of Solution
Contribution Margin: The process or theory which is used to judge the benefit given by each unit of the goods produced is called as contribution margin.
Calculate the total contribution margin in year 3 assuming the same quality costs as in year 1 compute the total contribution margin in year 3 using the actual quality costs for year 3:
| Year 3-No change | Year 3-change | |
| Sales | $22,000,000 | $22,000,000 |
| Variable expenses | (1)$14,473,684 | (6)$11,764,210 |
| Contribution margin | $7,526,316 | $10,235,790 |
Table (2)
Calculate the increase in profitability:
Therefore, the amount of increase in profitability is $2,709,474.
Working notes:
(1)Calculate the variable expenses in year 3 assuming the same quality costs as in year 1:
(2)Calculate the quality cost per unit for year 1:
(3)Calculate the quality cost per unit for year 3:
(4)Calculate the decrease in per-unit variable quality cost:
(5)Calculate the decrease in per-unit total variable cost:
(6)Calculate the total variable cost for year 3:
Want to see more full solutions like this?
Chapter 14 Solutions
Cornerstones of Cost Management (Cornerstones Series)
- Kindly help me with accounting questionsarrow_forwardAn ARO is to be calcualted for the Leashold improvement made in 2024. The book life given is 10 years (based on the lease) and it is Straight line depreciation.What are the amounts to capitalize and ARO when the given info is 1. total Capitalized cost is 1,100,000 2. estimated cost to tear down $200,000 the ridsk free Rate of interest is 3%, the firm assumes annual inflation of 2% - What is the future value of single payment (use inflation rate) - What is the present value of single payment (use risk free rate of return) What would be the entries for the years to be madearrow_forwardMETLOCK COMPANY Comparative Balance Sheet Assets Dec. 31, 2025 Dec. 31, 2024 Cash $33,900 $12,500 Accounts receivable 17,500 14,500 Inventory Prepaid insurance Stock investments 26,400 19,200 8,500 10,000 -0- 15,700 Equipment Accumulated depreciation-equipment Total assets 88,000 44,000 (15,500) (14,800) $158,800 $101,100 Liabilities and Stockholders' Equity Accounts payable $34,700 $7,900 Bonds payable 37,000 49,400 Common stock 40,400 24,300 Retained earnings 46,700 19,500 Total liabilities and stockholder's equity $158,800 $101,100 Additional information: 1 Net income for the year ending December 31, 2025 was $36,000. 2 Cash dividends of $8,800 were declared and paid during the year. 3. Stock investments that had a book value of $15,700 were sold for $12,000. 4. Sales for 2025 are $150,000. Prepare a statement of cash flows for the year ended December 31, 2025 using the indirect method. (Show amounts that decrease cash flow with either a-sign eg-15,000 or in parenthesise.g.…arrow_forward
- Kindly give a step by step details explaination of each answers especially question 5 and 6. Please, don't just give answers without explaining how we arrived at the answer. Thanks! The following are the questions: 1. What is the general journal entries the transactions described for Hogan Company. All sales are on account. Use the date of December 31 to make the entry to summarize sales for the year in the old territory and new territory. 2. Make the journal entries to record the write-off of accounts in the new territory. 3. Make the journal entry to record the write-off of accounts in the old territory. 4. Make the entry on December 31 to record uncollectible accounts expense for 20X1 for both territories. Make the calculation using the percentages developed by Hogan. 5. Let’s say the Allowance for Doubtful Accounts had a credit balance of $24,800 on September 30 before any of the above entries were made. Calculate the balance in the allowance account after…arrow_forwardFinancial accountingarrow_forwardGeneral Accountingarrow_forward
- Financial accounting questionsarrow_forwardThe standard composition of workers and their wage rates for producing certain product during a given month are as follows:• 12 skilled workers @ OMR 8 per hour each• 8 semi-skilled workers @ OMR 6 per hour each• 10 unskilled workers @ OMR 4 per hour eachDuring the month, the actual composition of workers was:• 10 skilled workers @ OMR 9 per hour each• 6 semi-skilled workers @ OMR 5 per hour each• 8 unskilled workers @ OMR 3 per hour eachThe standard output of the group was expected to be 5 units per hour. However, the workers were unable to produce any output for 8 hours due to a power failure. The group of workers was engaged for 120 hours during the month, and 580 units of output were recorded calculate LCV, LRV, LEV, LIIV, LYV and LMVarrow_forwardAnswer? ? General Accountingarrow_forward
 Cornerstones of Cost Management (Cornerstones Ser...AccountingISBN:9781305970663Author:Don R. Hansen, Maryanne M. MowenPublisher:Cengage Learning
 Managerial Accounting: The Cornerstone of Busines...AccountingISBN:9781337115773Author:Maryanne M. Mowen, Don R. Hansen, Dan L. HeitgerPublisher:Cengage Learning
 Essentials of Business Analytics (MindTap Course ...StatisticsISBN:9781305627734Author:Jeffrey D. Camm, James J. Cochran, Michael J. Fry, Jeffrey W. Ohlmann, David R. AndersonPublisher:Cengage Learning
 Excel Applications for Accounting PrinciplesAccountingISBN:9781111581565Author:Gaylord N. SmithPublisher:Cengage Learning


